Model Monitoring
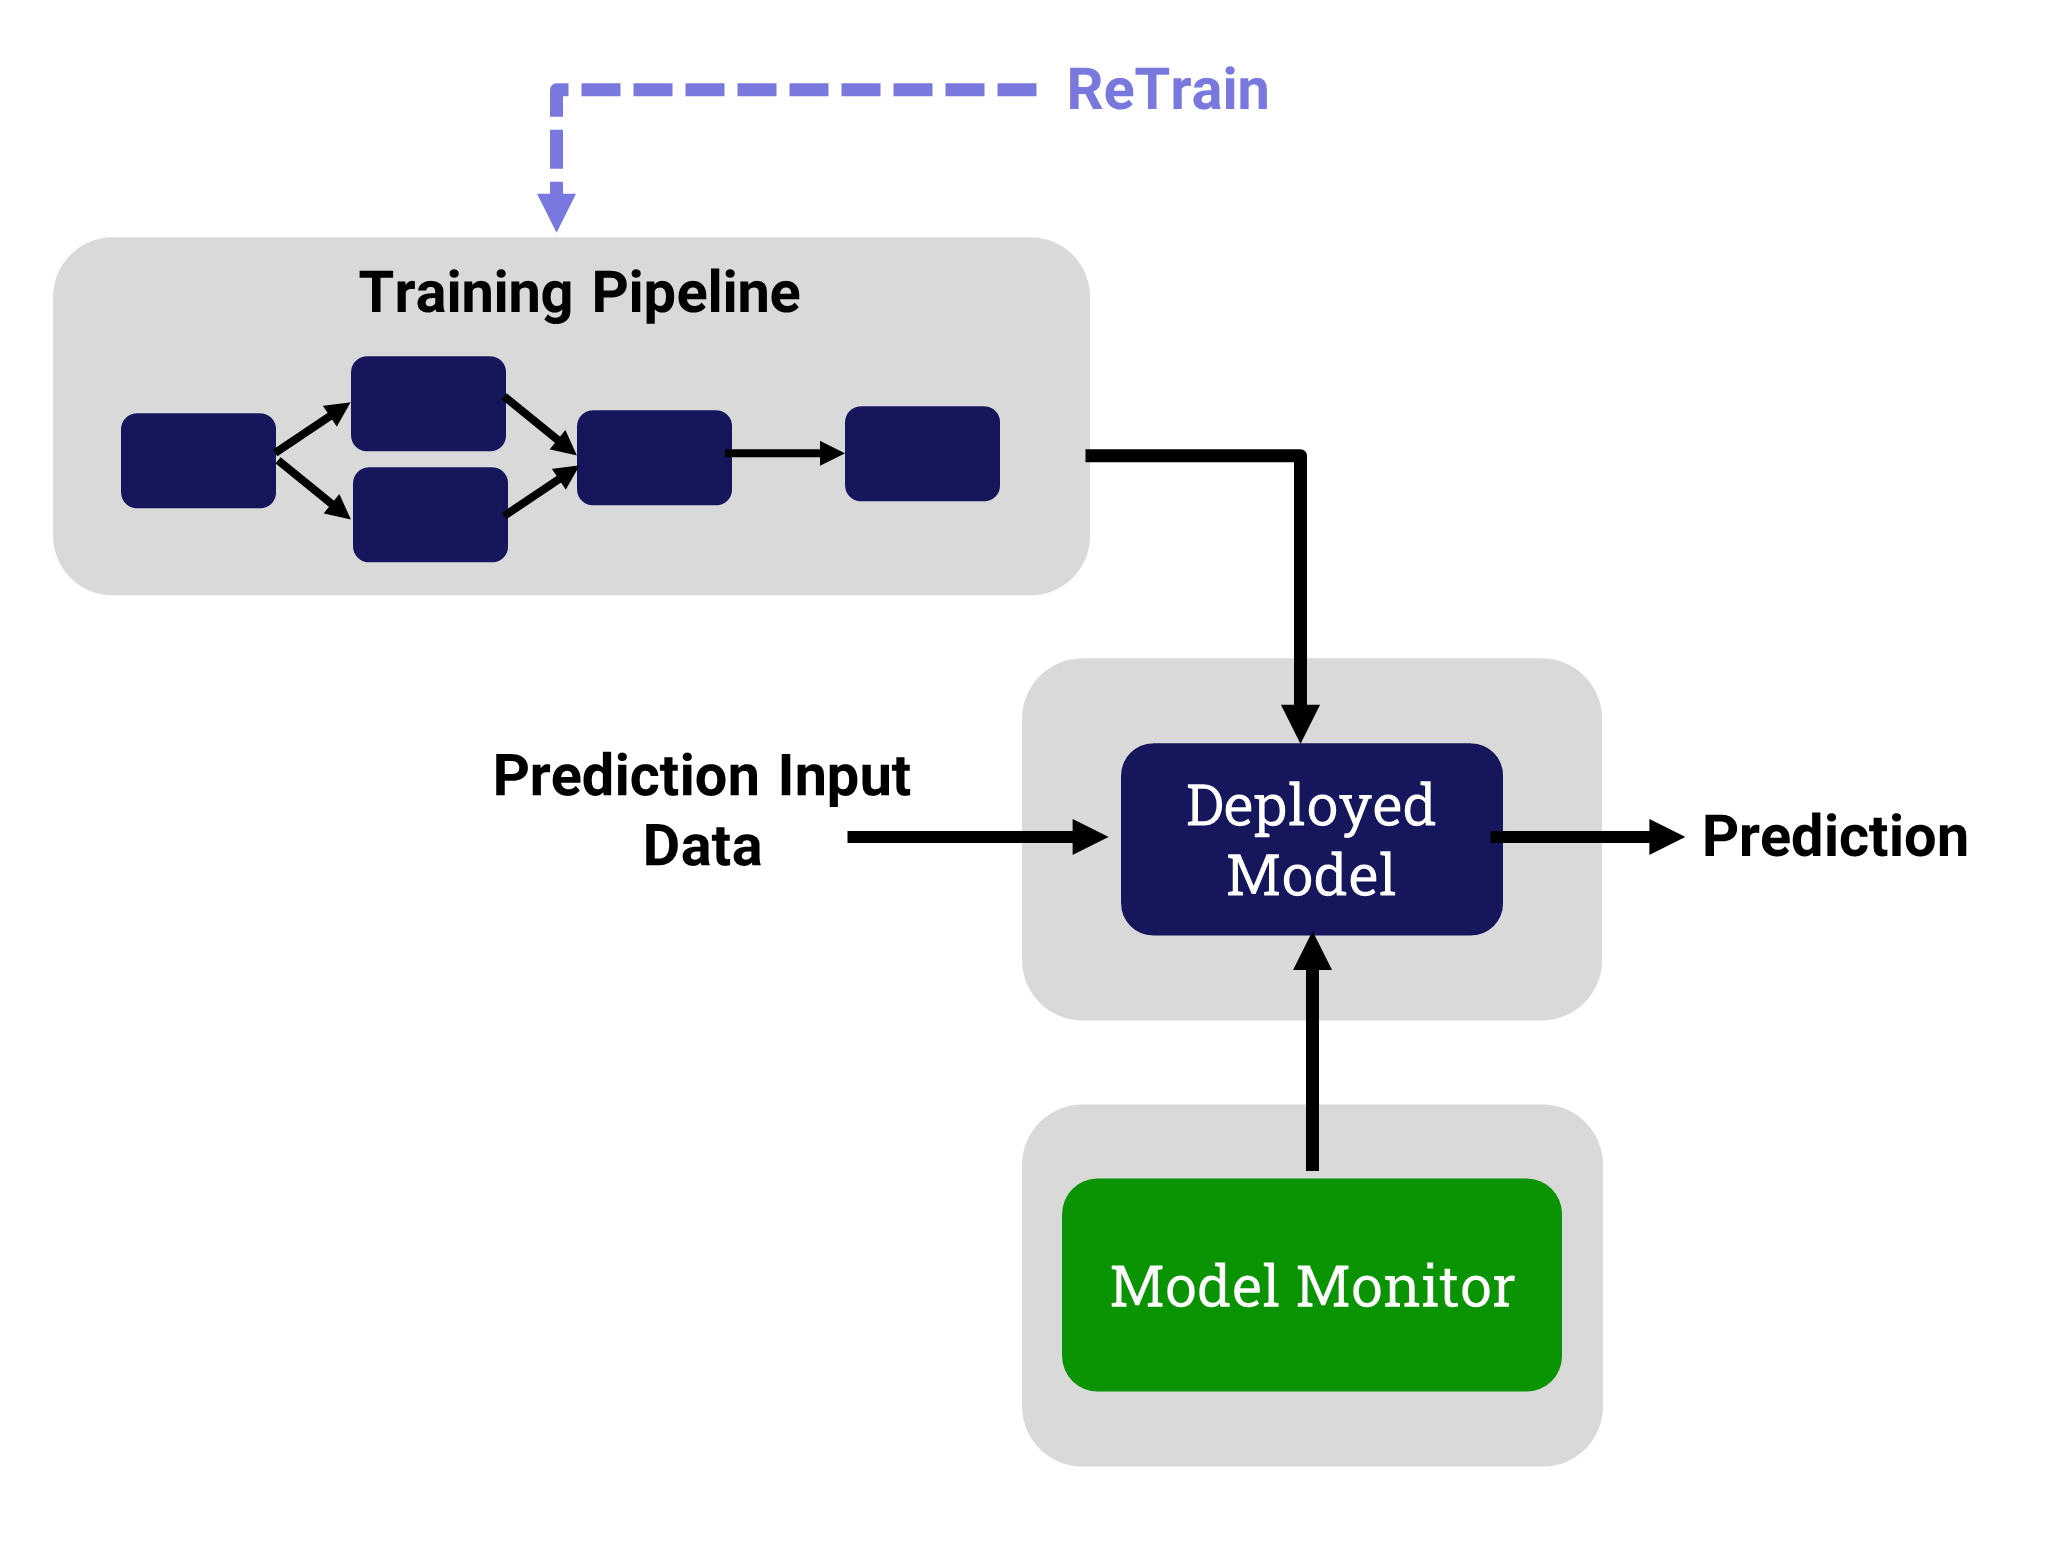
Over time, models can degrade, providing prediction results that no longer achieve your business goals. DKube integrates model monitoring into the overall workflow. This allows the data science or production teams to monitor the serving results, and take action if the results are no longer within acceptable tolerances.
Local and remote deployments can be monitored
Monitors can be created using data files or running deployments
Status and Alerts can be set up based on goals and thresholds
A Dashboard provides a snapshot of all monitored models
Problems can be viewed in a set of hierarchical graphs
The problem, and its root cause, can be determined
Retraining and redeployment can be performed
Monitoring Concepts
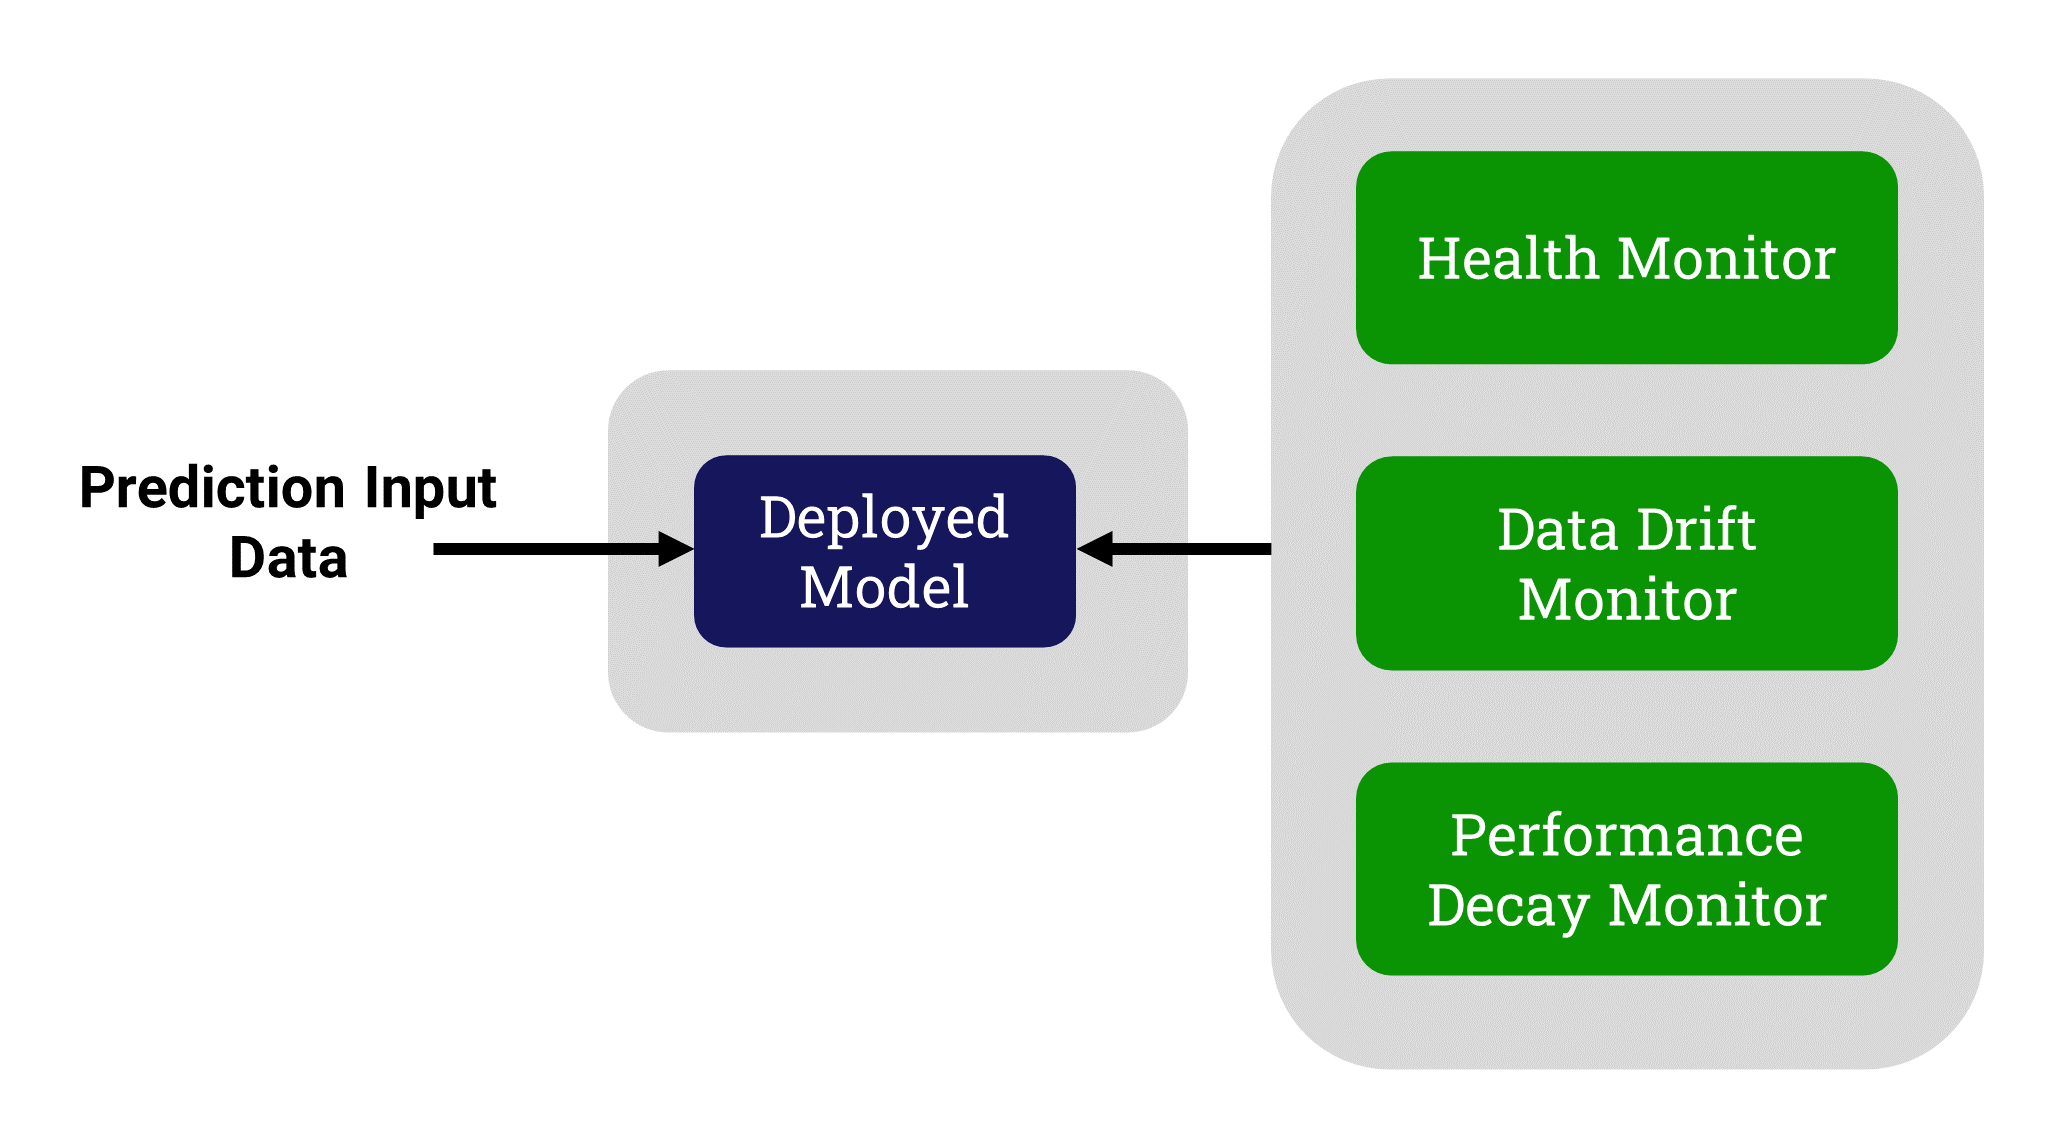
There are 3 different components of monitoring within DKube:
Health Monitoring
Monitor the health of the deployment based on statistics passed to the monitor
Data Drift Monitoring
Monitor the difference between the input data during training and the current prediction input data
Monitor the difference between the training predictions and the current predictions of the model (Concept Drift)
Performance Decay Monitoring
Monitor the metrics of the current model
Performance decay monitoring requires both a prediction and the accurate results, called Ground Truth
Monitoring Results
The monitoring components provide information in 2 different ways: Status and Alerts
Status
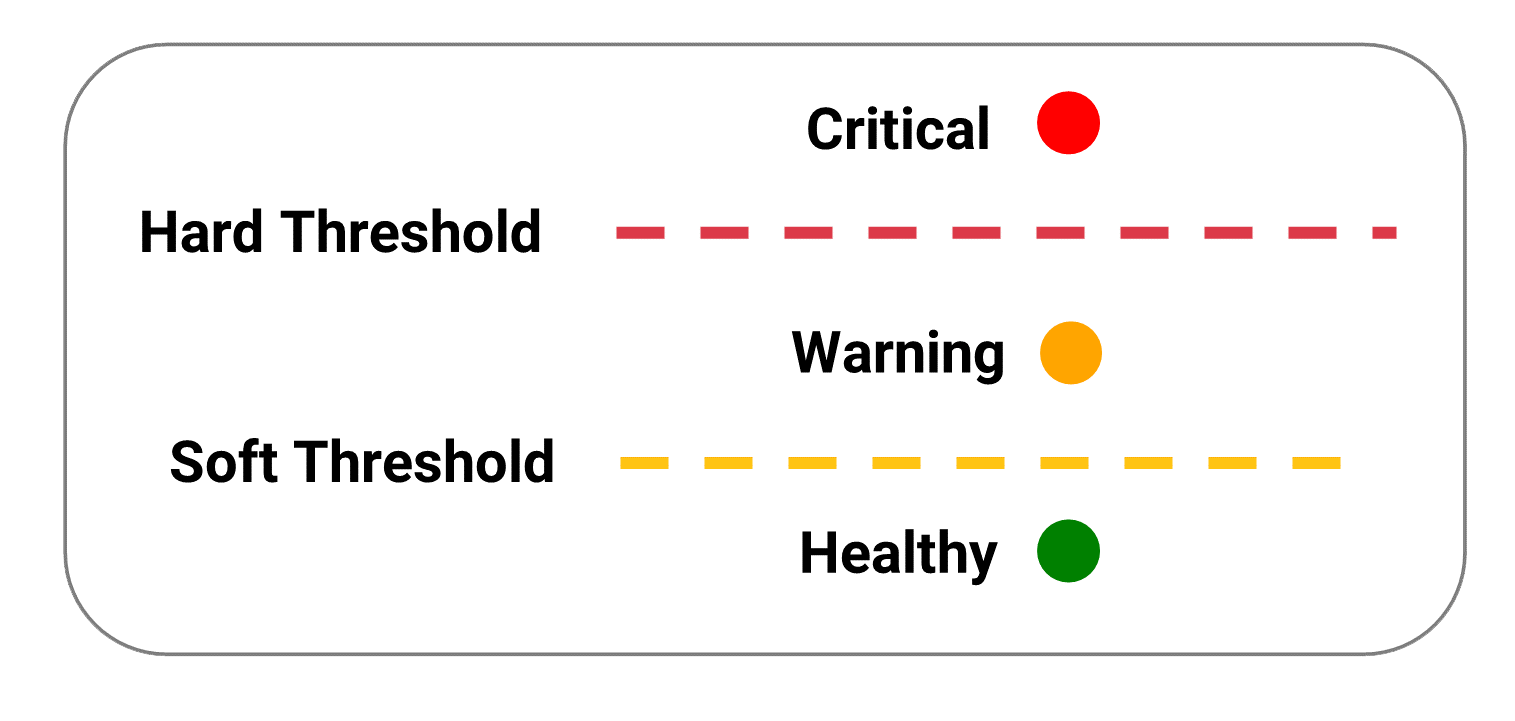
The status of a monitor component provides information on the current condition of the deployment. The status is determined by how the feature drift or metrics compare to the soft and hard thresholds that are uploaded to the monitor.
The meaning of the status depends upon which screen is being shown. For the detailed screens, each feature and metric has it’s own status indication that is based on the rules above. The Dashboard status indication provides a summary of the status.
There are 3 possible status indications:
Screen |
Status |
Definition |
|
|---|---|---|---|
Detailed |
Healthy |
|
The feature drift or metric is less than the soft threshold |
Warning |
|
The feature drift or metric is greater than the soft threshold, but less than the hard threshold |
|
Critical |
|
The feature drift or metric is greater than the hard threshold |
|
Dashboard |
Healthy |
|
All feature drifts and metrics are below their individual thresholds |
Warning |
|
At least one feature drift or metric is greater than its soft threshold, but none are above the hard threshold |
|
Critical |
|
At least one feature drift or metric is greater than its hard threshold |


Note
The status indications show the current condition of the features or metrics based on the last prediction request. They do not provide historical information on previous status conditions.
Alerts
Alerts provide an indication that a feature drift or metric matches the criteria set when the alert is created. When the alert is triggered, it will show up on the detailed screen.
The alert can be configured to trigger based on:
The status of the feature drift or metric (warning or critical)
A threshold set when the alert is created
Note
The alert threshold is separate from the status threshold. They are configured independently, have different meaning, and are handled differently.
Health Monitoring
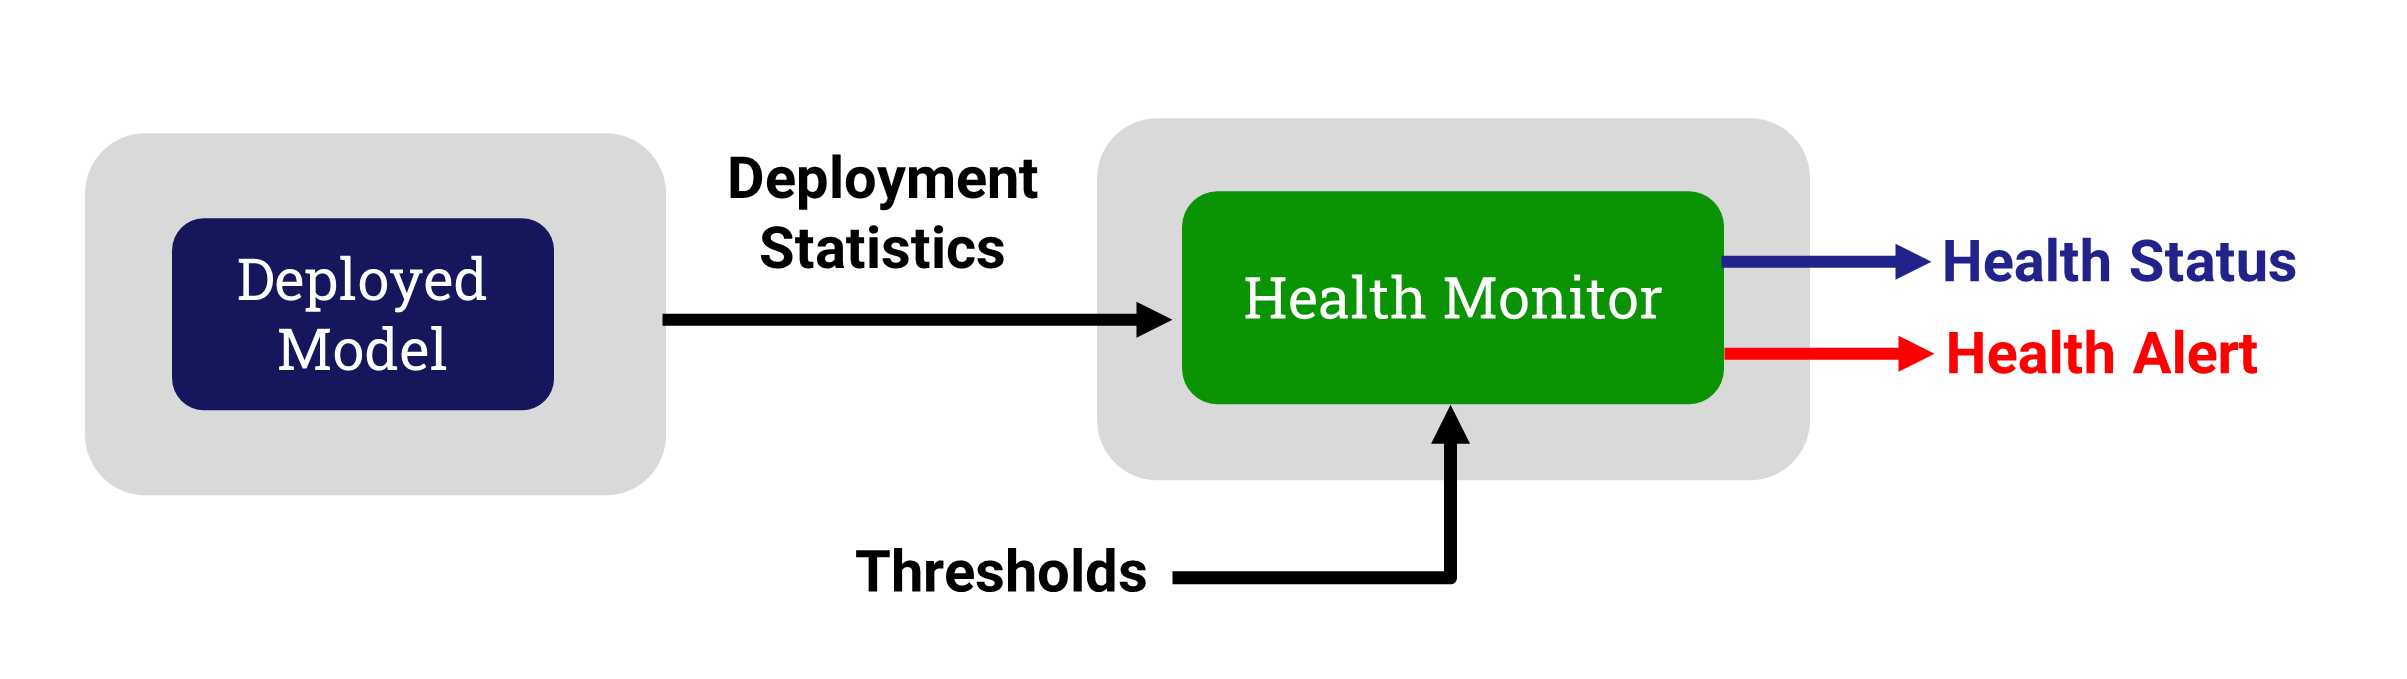
The Health monitor tracks statistics from the deployment, and provides status and alerts based on the monitor configuration.
Data Drift
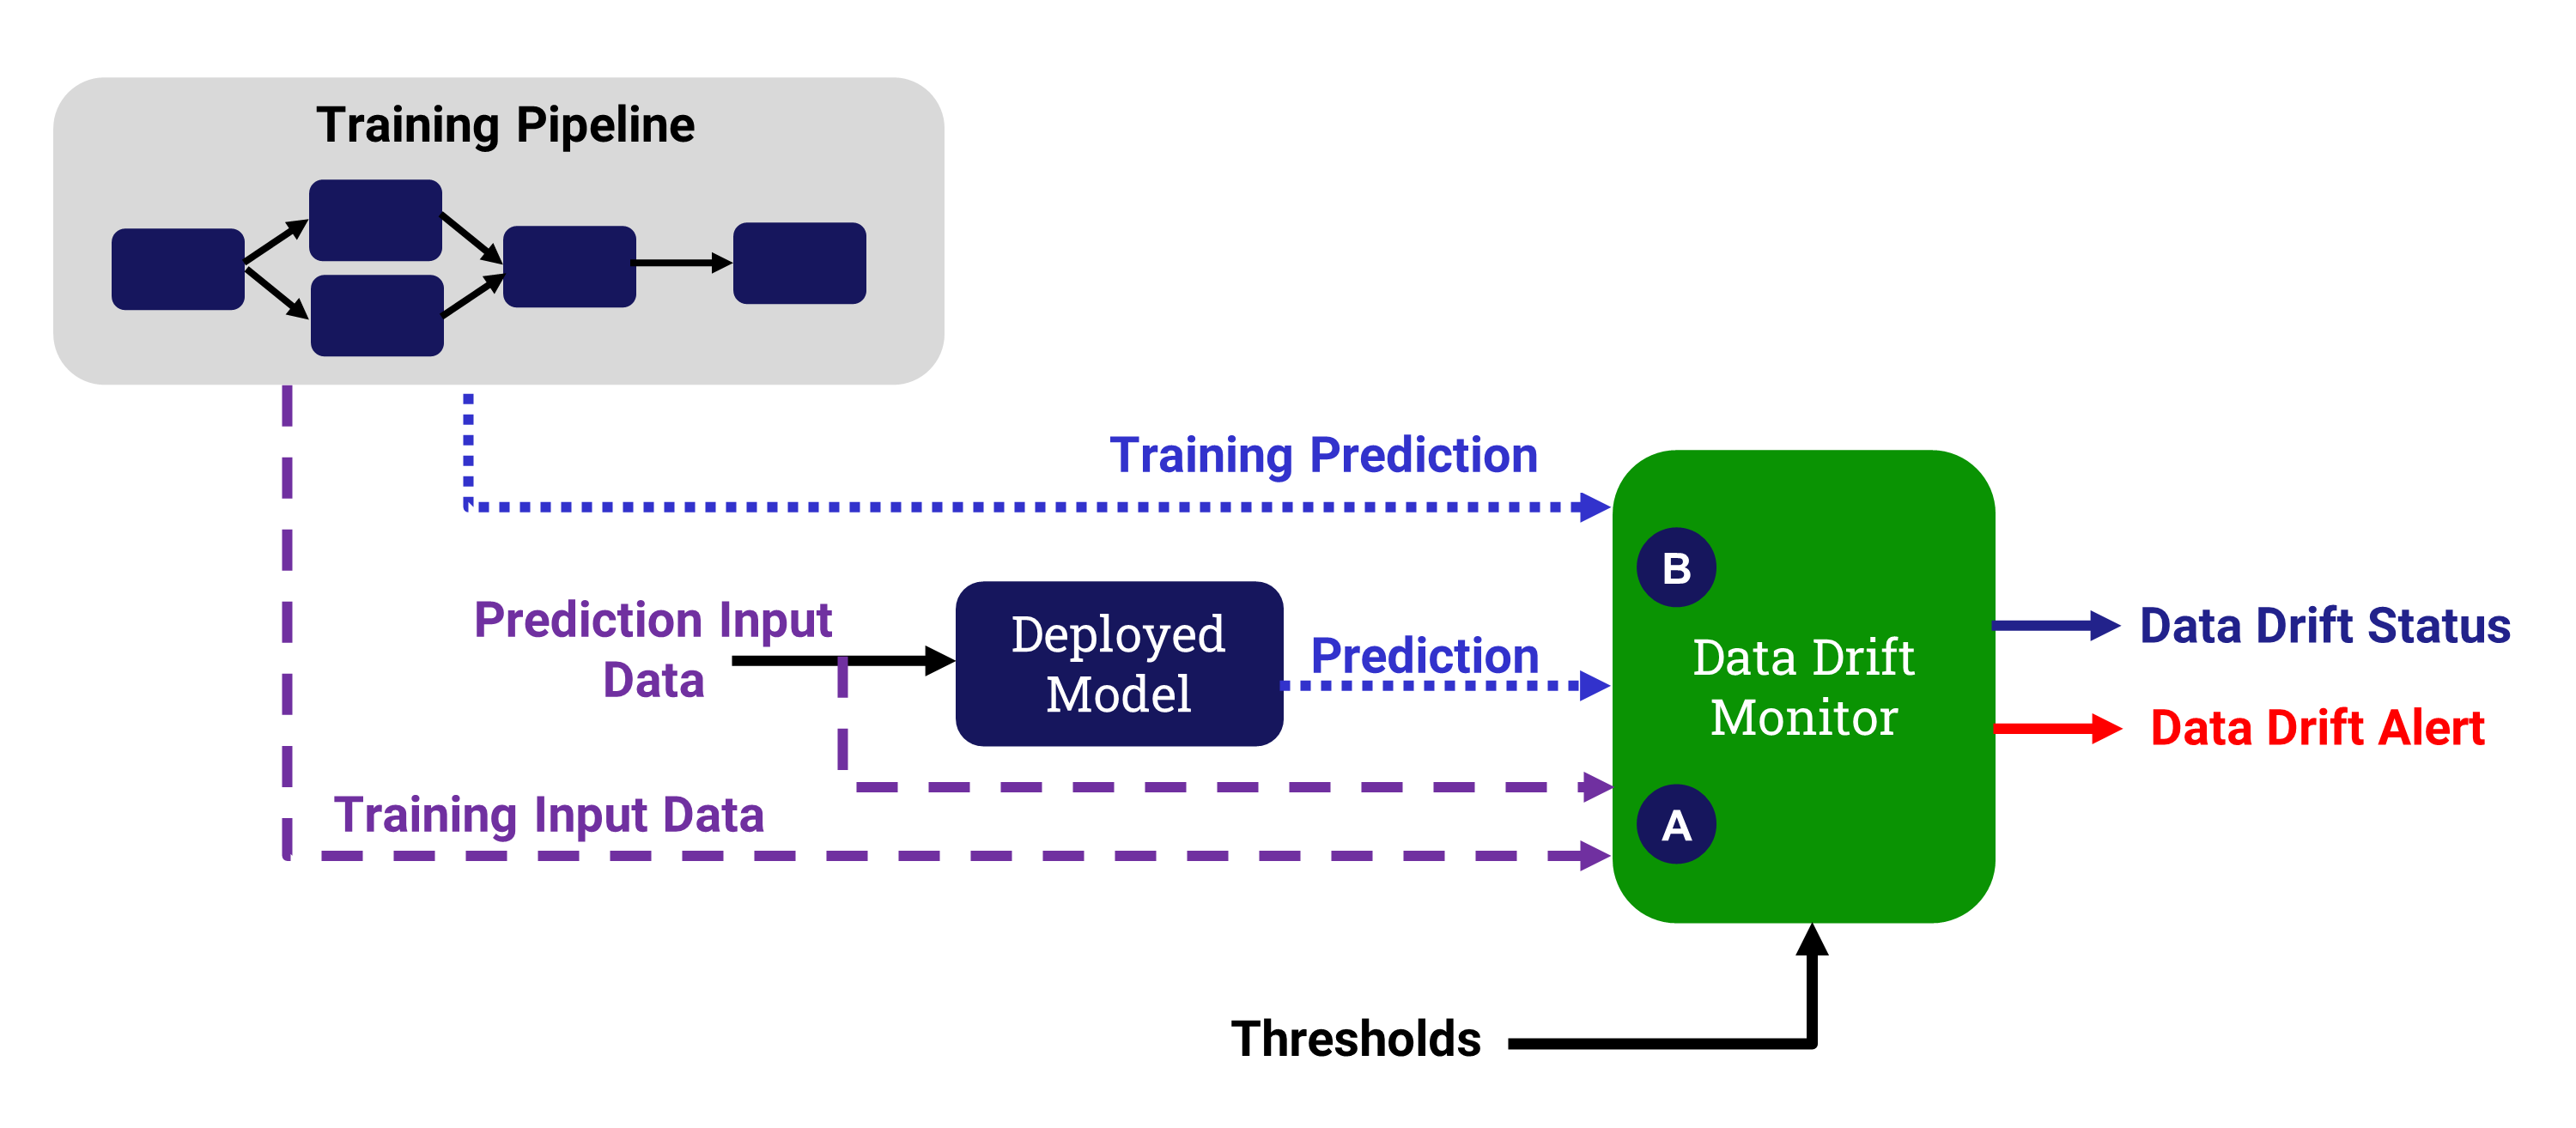
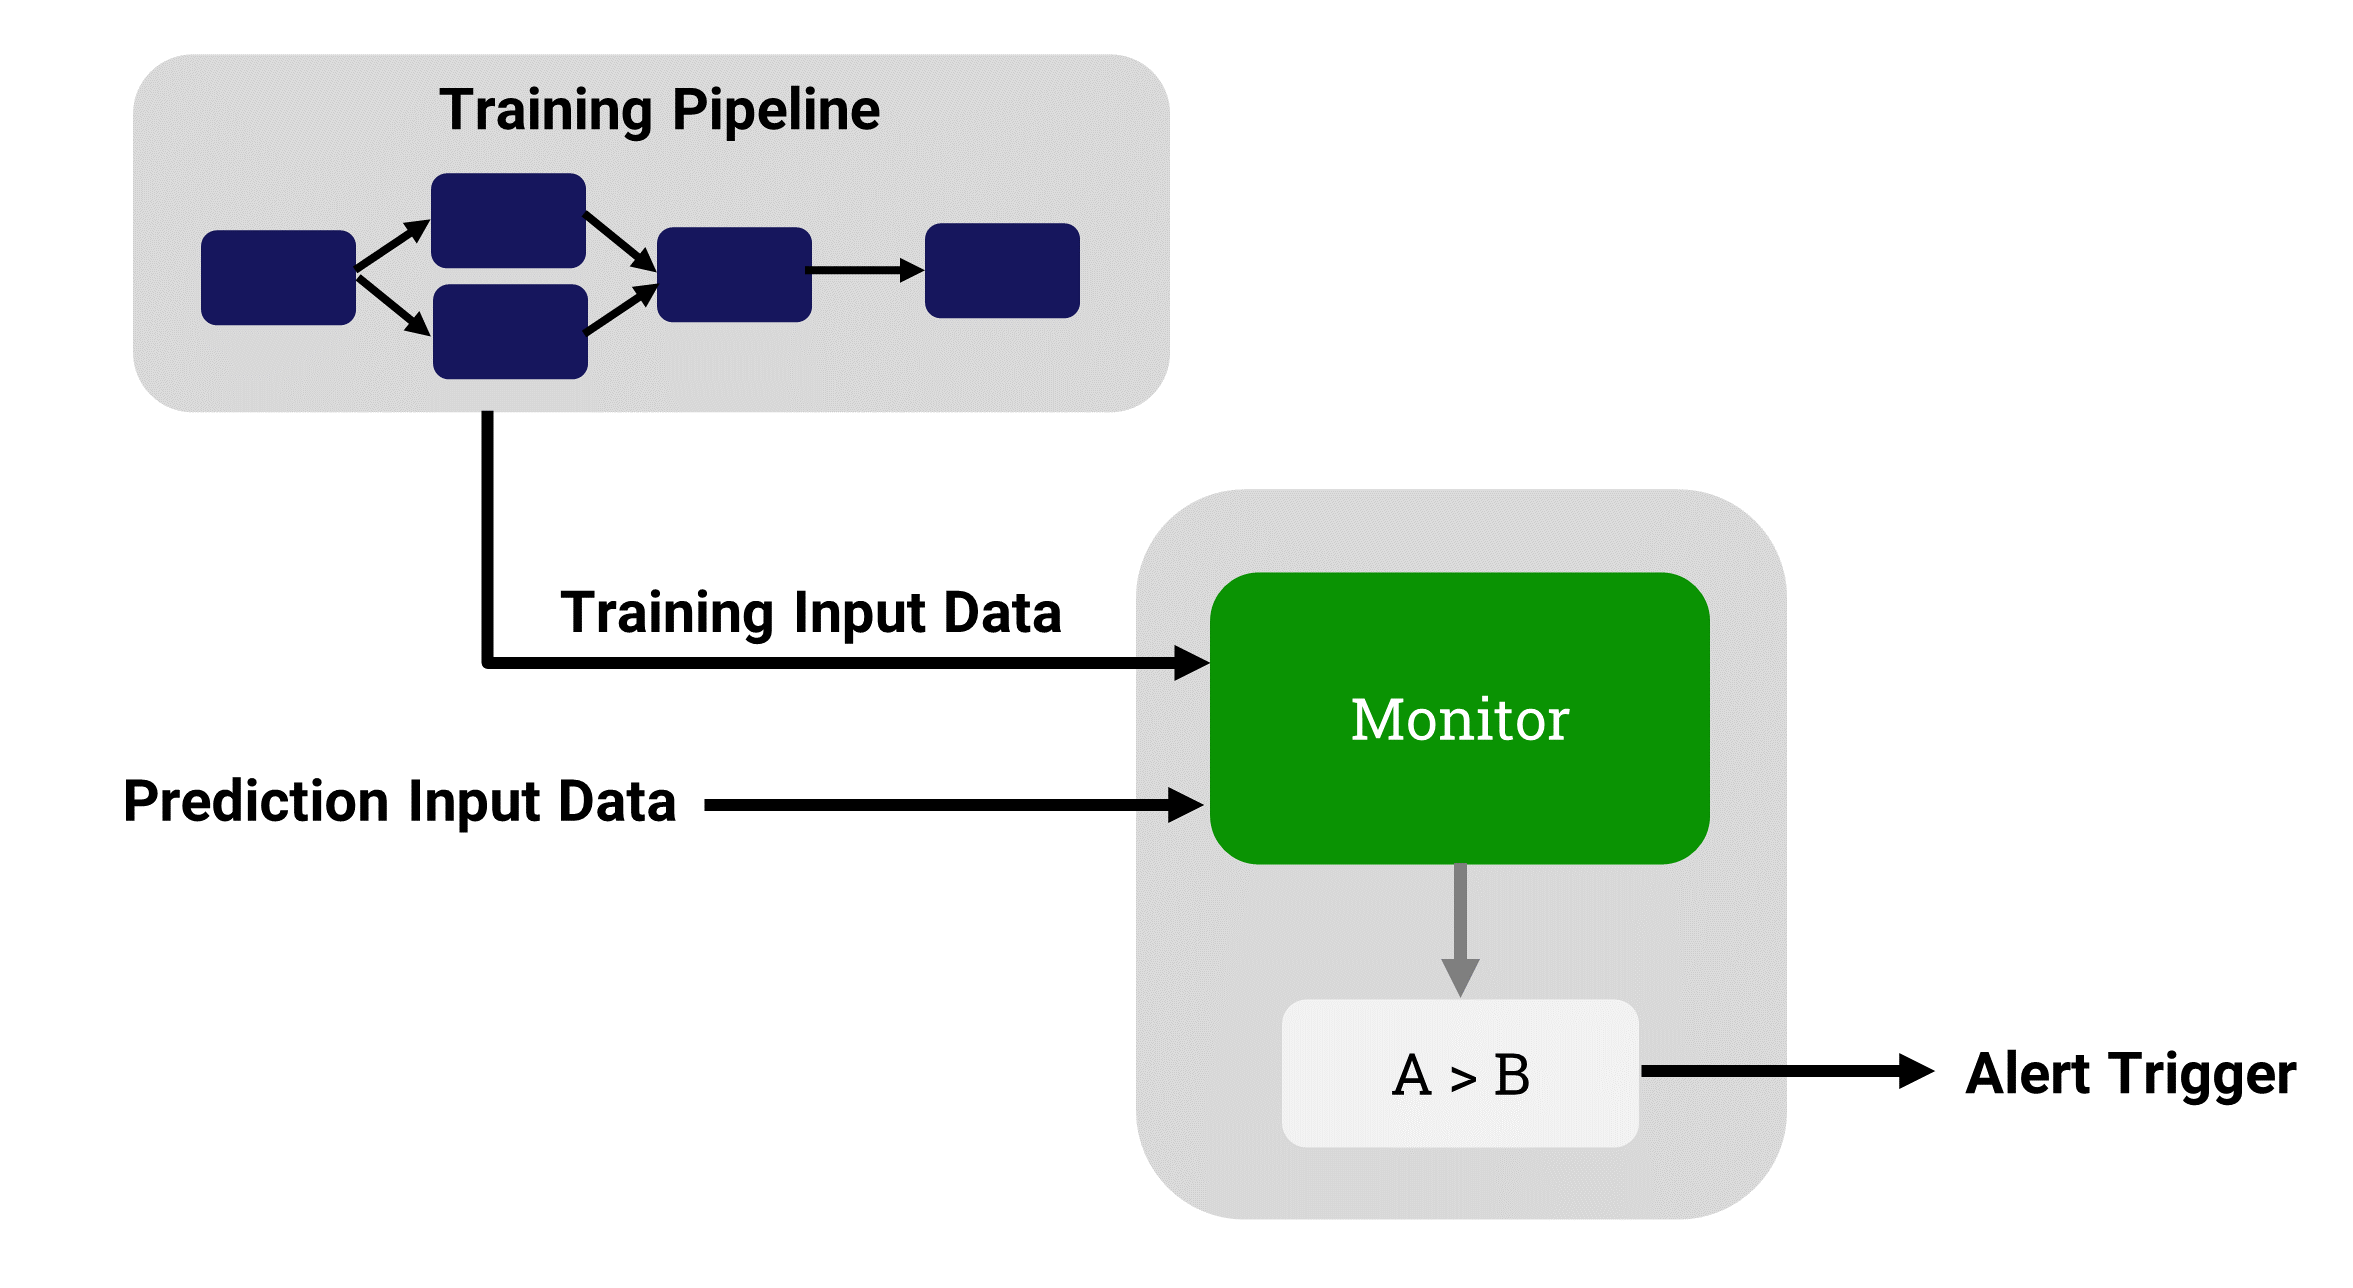
Data Drift monitors how the existing inputs and predictions compare to the original model training. In the diagram above:
Drift Type |
Figure |
Definition |
|---|---|---|
Input |
A |
The Prediction Input Data is compared to the original Training Input Data |
Prediction |
B |
The model Predictions are compared to the original Training predictions |
Note
Data Drift monitoring does not depend upon the accuracy of the predictions. No Ground Truth is required. It simply shows how the current model is operating compared to the original training for the model.
Performance Decay
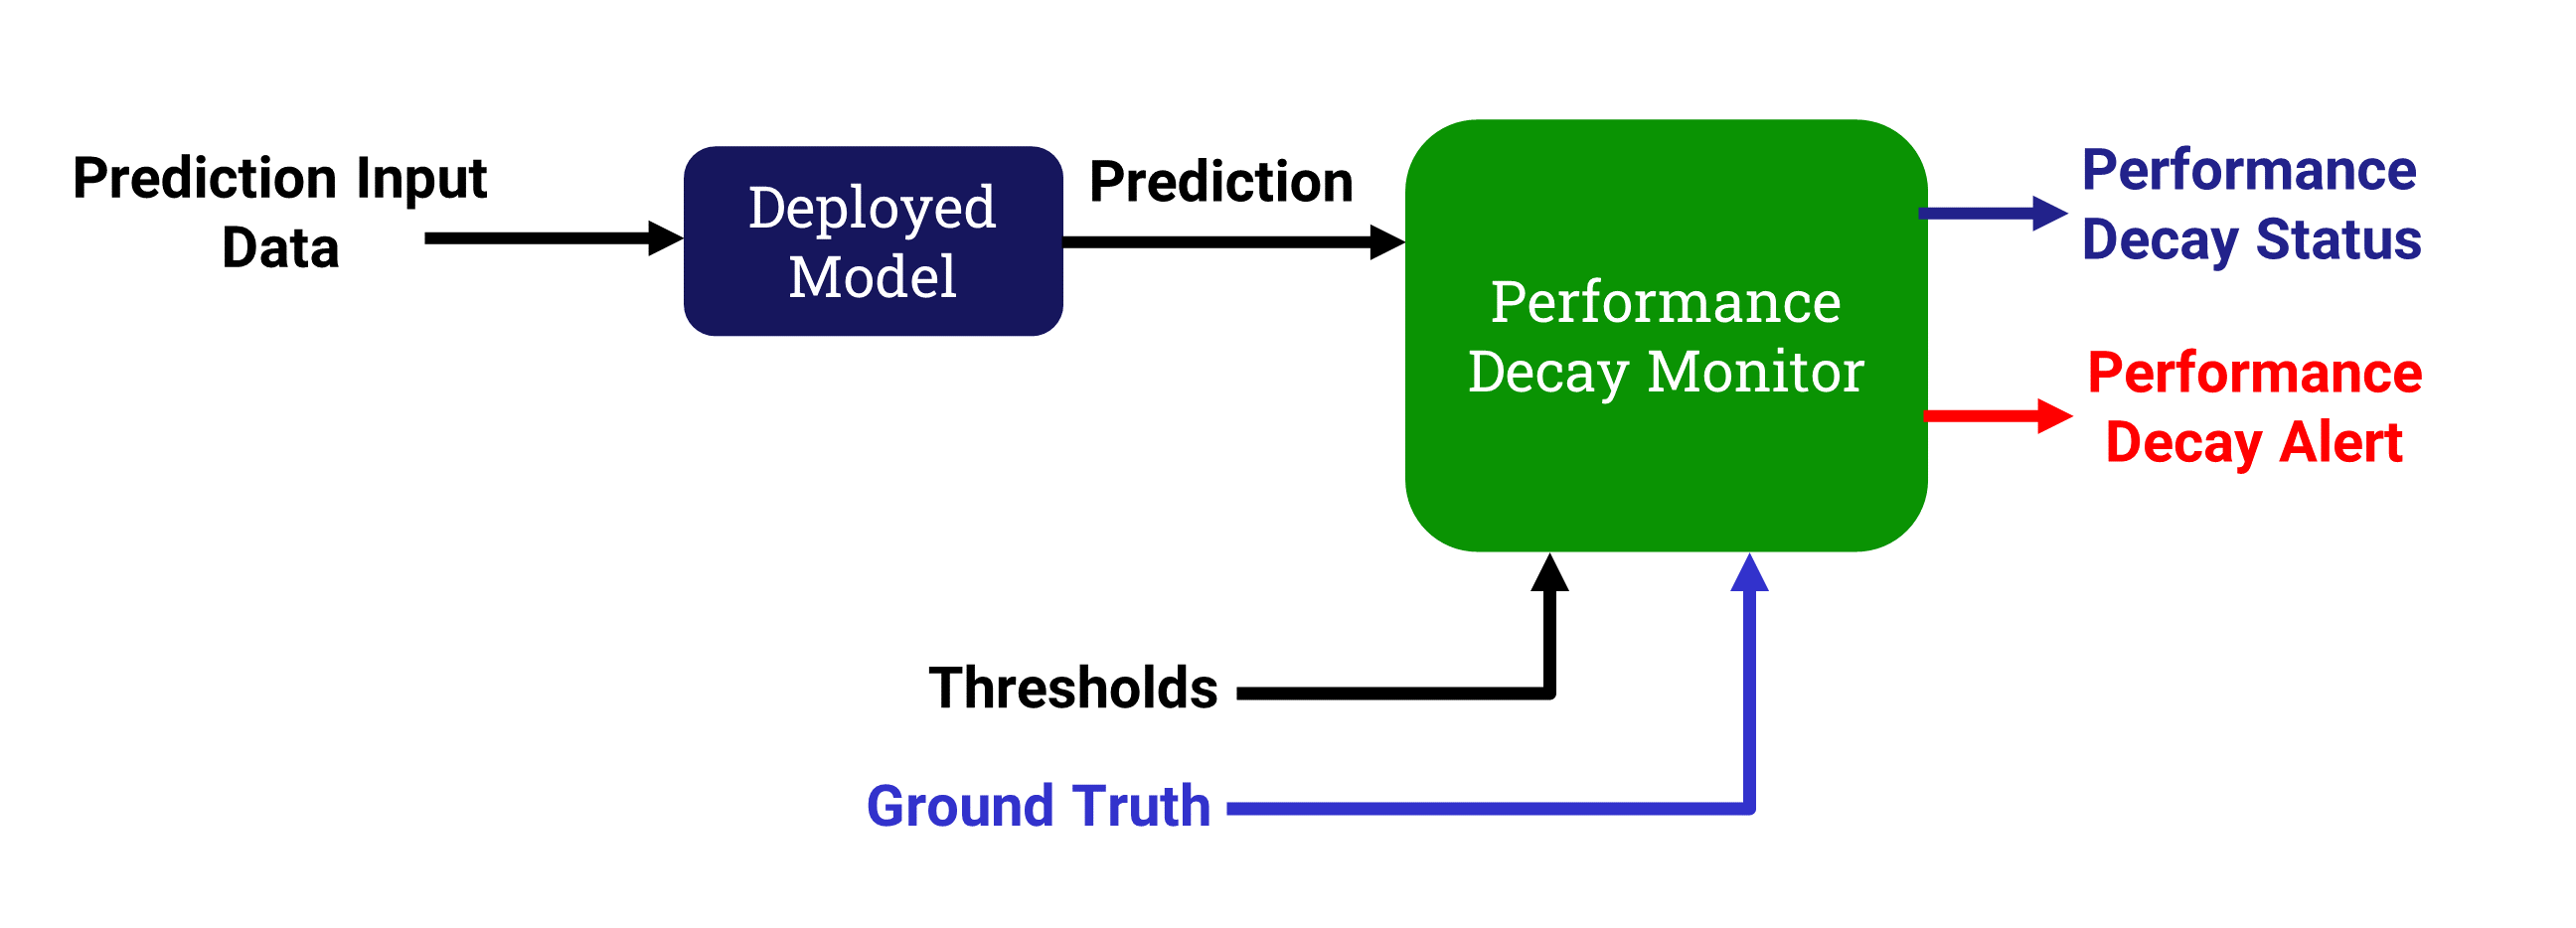
Performance Decay monitoring calculates the model metrics based on the model prediction and the correct prediction provided by the Ground Truth. The Ground Truth is created by an expert in the domain, and added to the inputs and model predictions.
Monitor Workflow
The general workflow to make use of the model monitoring system is described in this section.
Workflow |
Description |
|---|---|
Create or import a deployment |
|
Add a monitor for the deployment |
|
Update the schema |
|
Create alerts for the monitor |
|
Optionally upload a file that sets status thresholds for the monitor |
|
The monitor can be modified after it has been created |
|
The status of the monitors and alerts can be viewed in real-time from the monitor dashboard screen |
|
Based on the alerts, a specific monitor can be hierarchically investigated to determine what is causing the alert |
Note
It is possible to set up a monitor without a running model, based solely on a set of files. These files can be created manually or automatically from a running model or through a program.
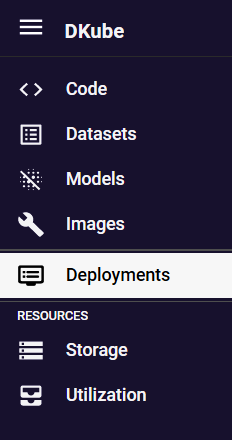
Monitor Menu
The Monitor screens provide a UI-based mechanism to navigate through the workflow.
Menu Item |
Description |
Guide |
|---|---|---|
Code |
Create, view, and manage the Code repos |
|
Datasets |
Create, view, and manage the Dataset repos |
|
Models |
Create, view, and manage the Model repos |
|
Images |
Catalog of images for use in IDEs & Runs |
|
Deployments |
Create, view, and manage deployments and monitors |
|
Monitors are described in this section |
||
Storage |
View the storage utilization for the user |
|
Utilization |
View the CPU, GPU, memory, and pod utilization for the user |
Deployments Dashboard
In order to monitor a model (or set of files), a Deployment must be created or imported. The following deployment approaches are possible:
Create a deployment from a trained model Deployments
Import a deployment from a remote cluster, described in this guide
Create a dummy deployment in order to create a monitor for a set of files
Note
A Monitor requires a Deployment, and there can only be a single Monitor for a Deployment. The Monitor name will be the same as the Deployment name.
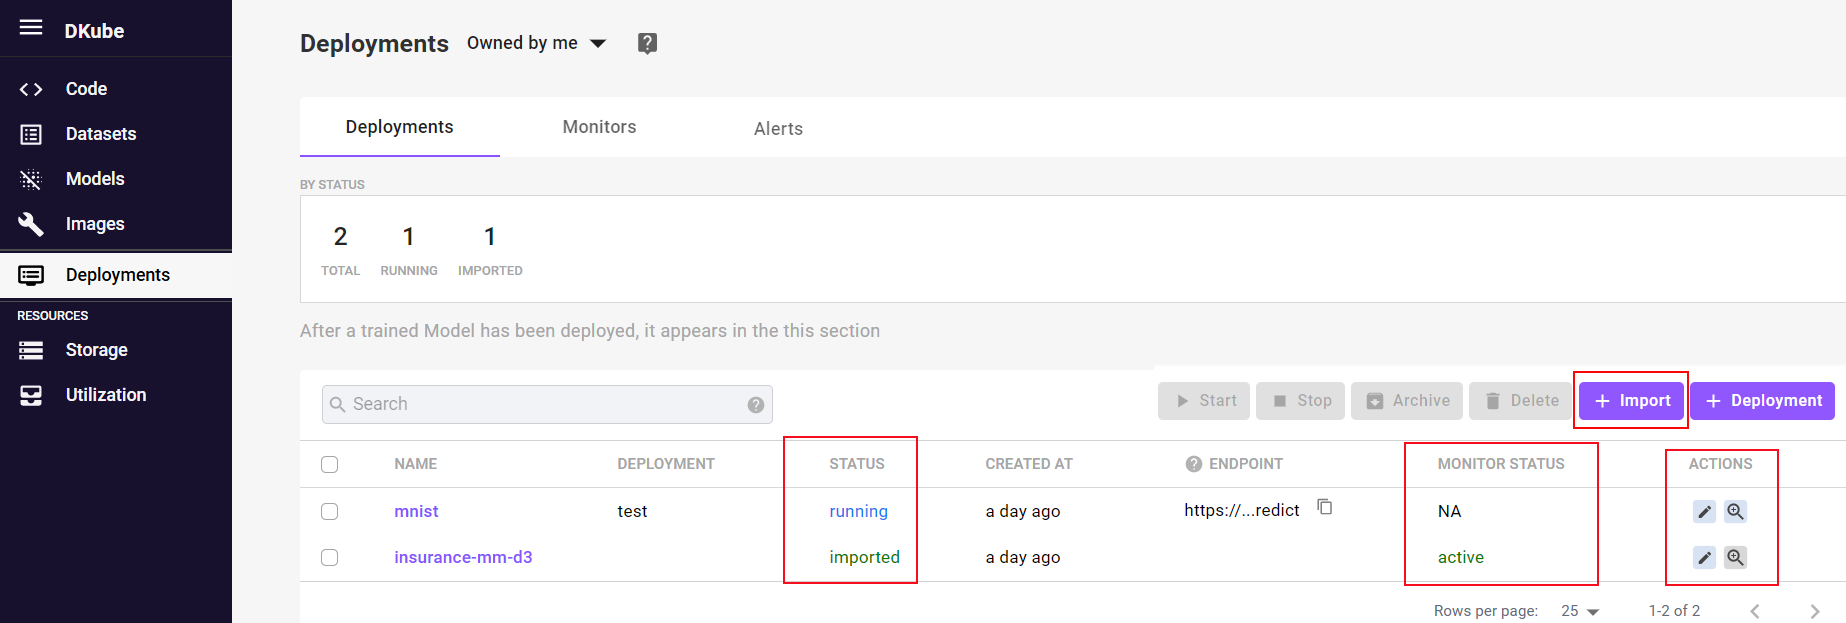
The Deployments Dashboard provides a summary of the currently active deployments.
The Status column identifies whether the deployment has been created from within DKube or imported
If the deployment has been created within DKube, an endpoint URL is provided
If the deployment includes a monitor, the status of the monitor is provided
The following actions are possible for each deployment:
Action |
Deployment Type |
Description |
|---|---|---|
Edit |
Running |
Change the model being deployed for that endpoint Change Model Deployment |
Edit |
Imported |
Change the remote deployment |
Add Monitor |
Both |
Add a monitor to the deployment |
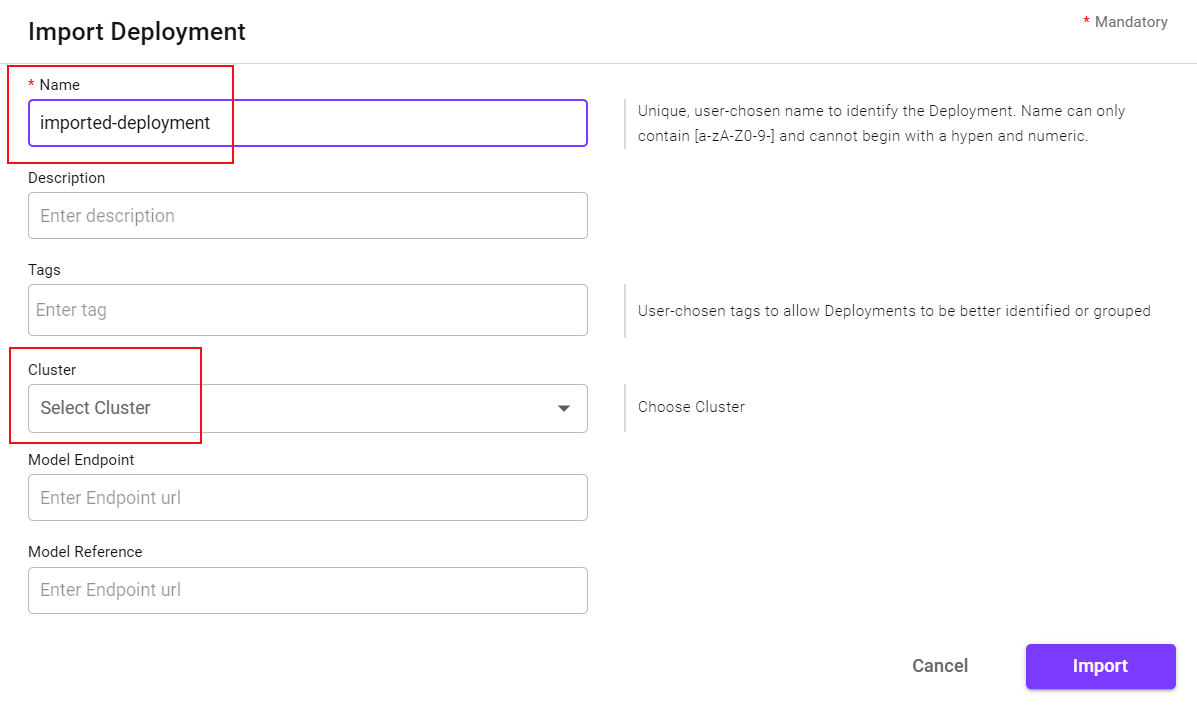
Import Deployment
In order to monitor a remote model, or to monitor using a set of files, the deployment must first be imported to the local DKube cluster. Select the button, which brings up the import popup.
Field |
Description |
|---|---|
Name |
Mandatory name of the deployment, which will also be the name of the monitor when it is created |
Description/Tags |
Optional fields providing more context for reviewing or filtering |
Cluster |
Optional cluster name if the model has been deployed on a remote cluster. Clusters are added as described at Multicluster Management |
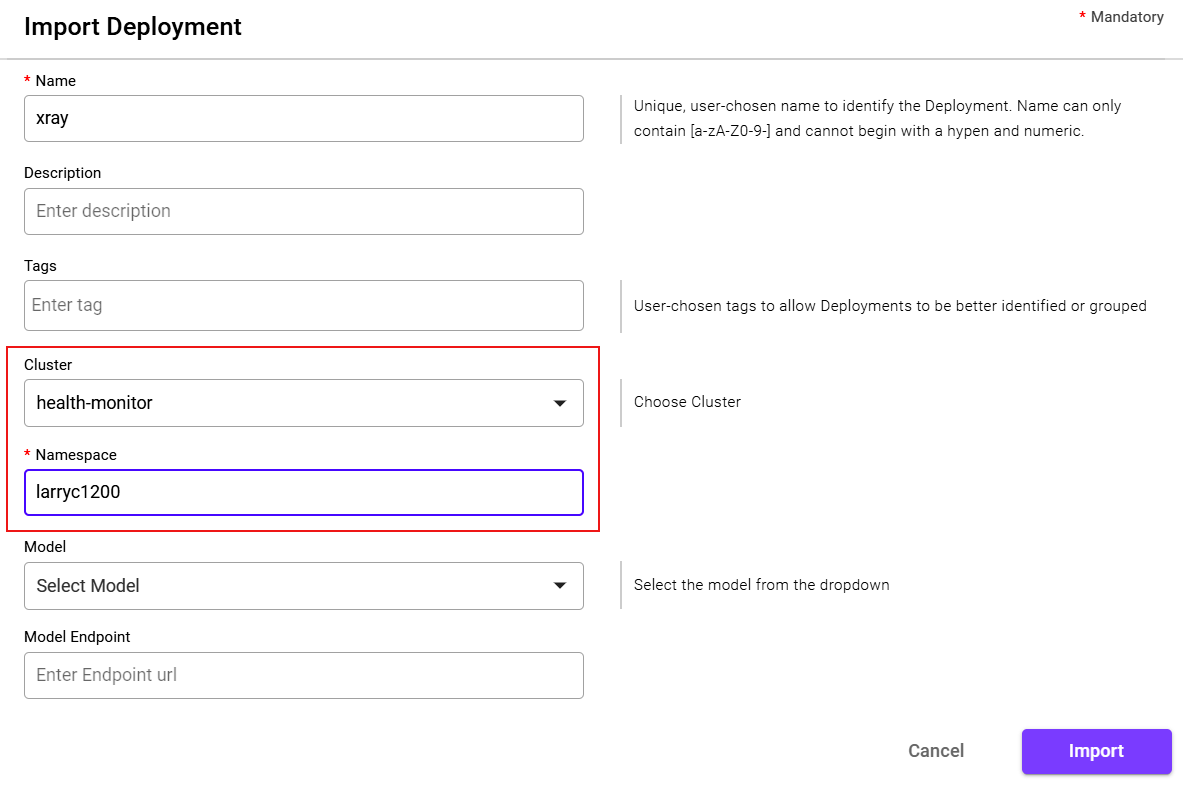
The Name field rules are as follows:
Import Type |
Description |
|---|---|
Remote Model |
Must must match the deployment name on the remote cluster |
Dummy Deployment |
User-chosen name |
If the deployment is coming from a remote cluster, the Namespace field should be set to the Username on the Serving cluster.
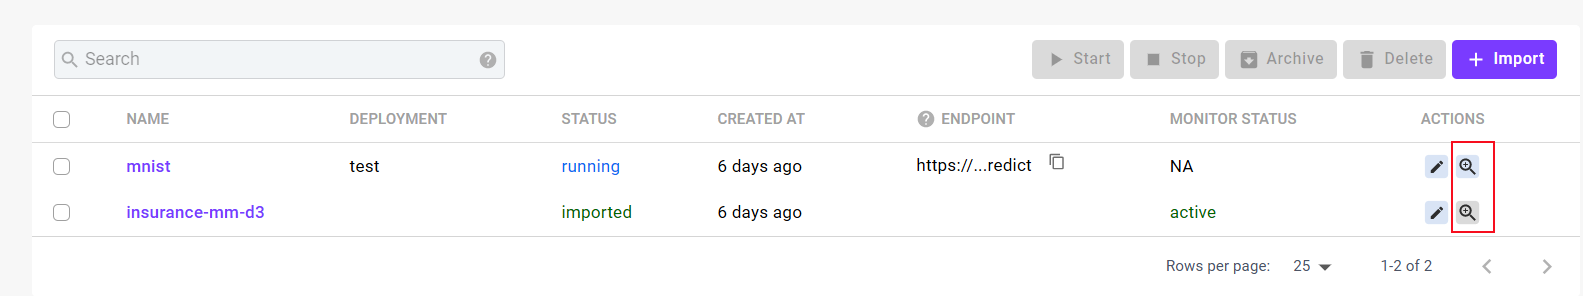
The Fields other than the Name field can be modified through the Edit icon after the deployment has been imported.
Create a Monitor
A monitor can be added by selecting the “Add Monitor” action icon. This will bring up a screen where the basic monitor fields can be filled in. Once the monitor has been added to the deployment, it can be further configured from the monitor dashboard screen.
Note
After the required inputs have been entered and the new monitor submitted, the Schema can be directly accessed. The Schema can also be modified later from the Monitor Dashboard screen.
Note
The Settings tab needs to be filled in, and only the other tabs that are required for monitoring. Do not select the “Submit” button until all of the tabs have been filled in.
Basic Settings
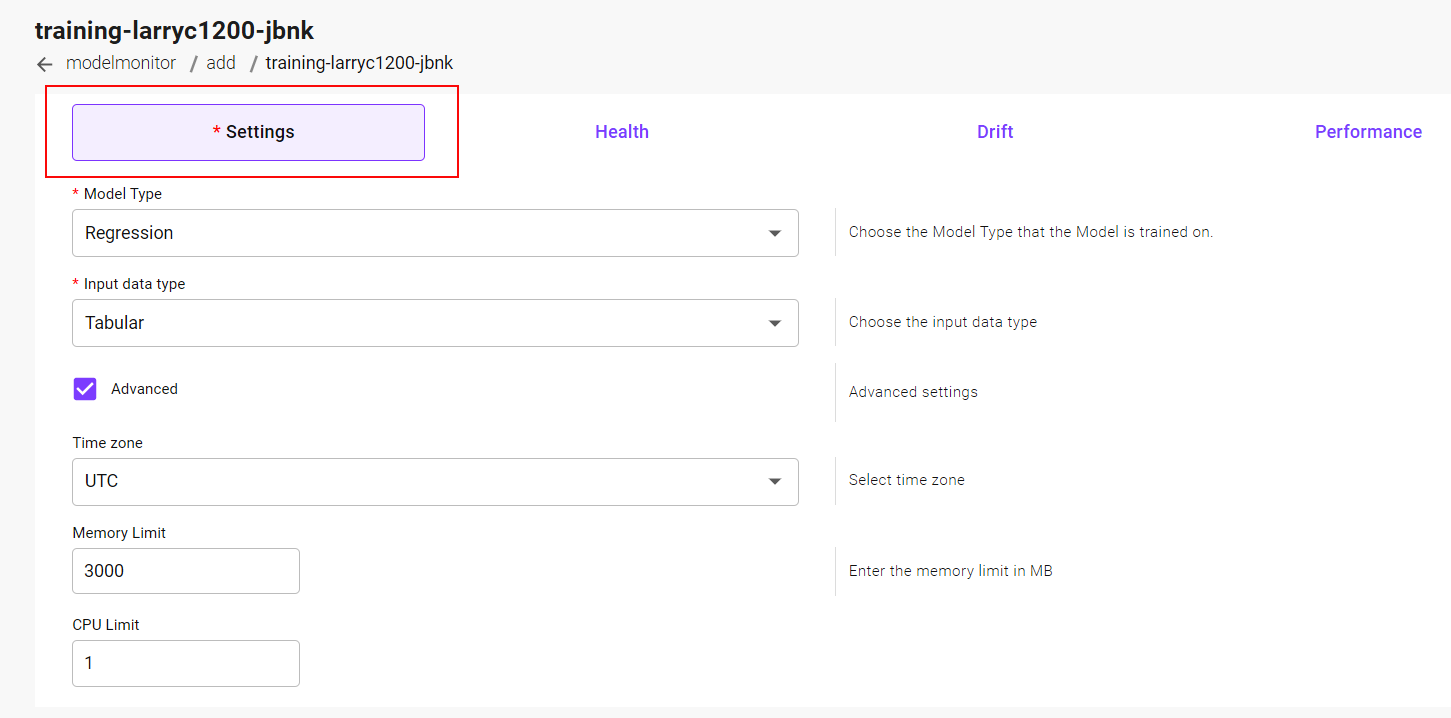
Field |
Description |
|---|---|
Model Type |
Type of model being monitored, such as regression or classification |
Input Data Type |
Type of data being monitored, such as tabular or image |
Advanced |
Select to add other configuration |
Health Monitor
The health of a real deployment can be monitored. This tab will not be selectable when monitoring a set of files. This is described in Health Monitoring
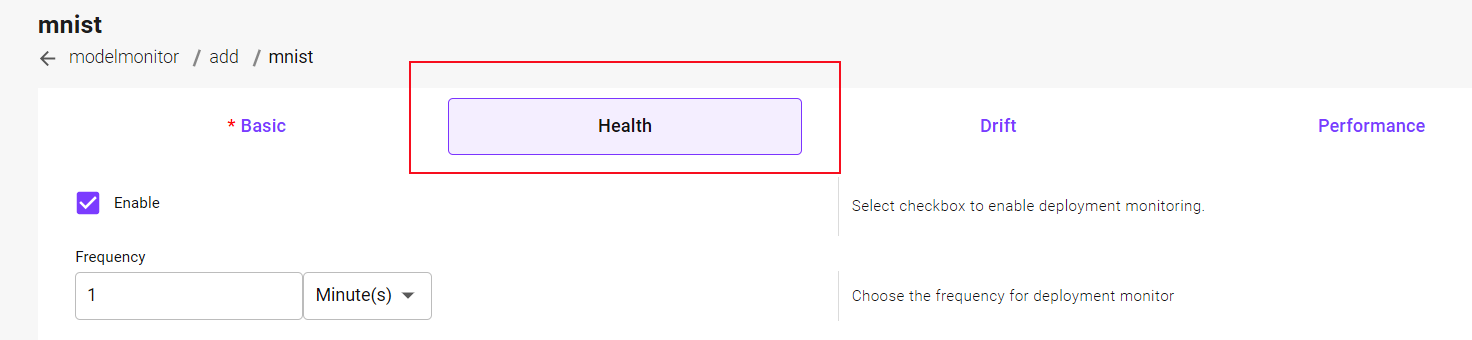
Field |
Description |
|---|---|
Enable |
Enable the monitoring of the health of the deployment on the cluster |
Frequency |
Select how often the health monitor should run |
Data Drift Monitor
The Drift screen sets up the monitor for data drift. The monitor will compare the input data and predictions compared to the original training data, as described in Data Drift
For locally running deployments, or deployments that have been imported from a remote cluster, most of the fields will be filled in based on the deployment metadata
For a dummy deployment, where the monitor is based on files and not running deployments, the fields must be filled in to identify what needs to be monitored
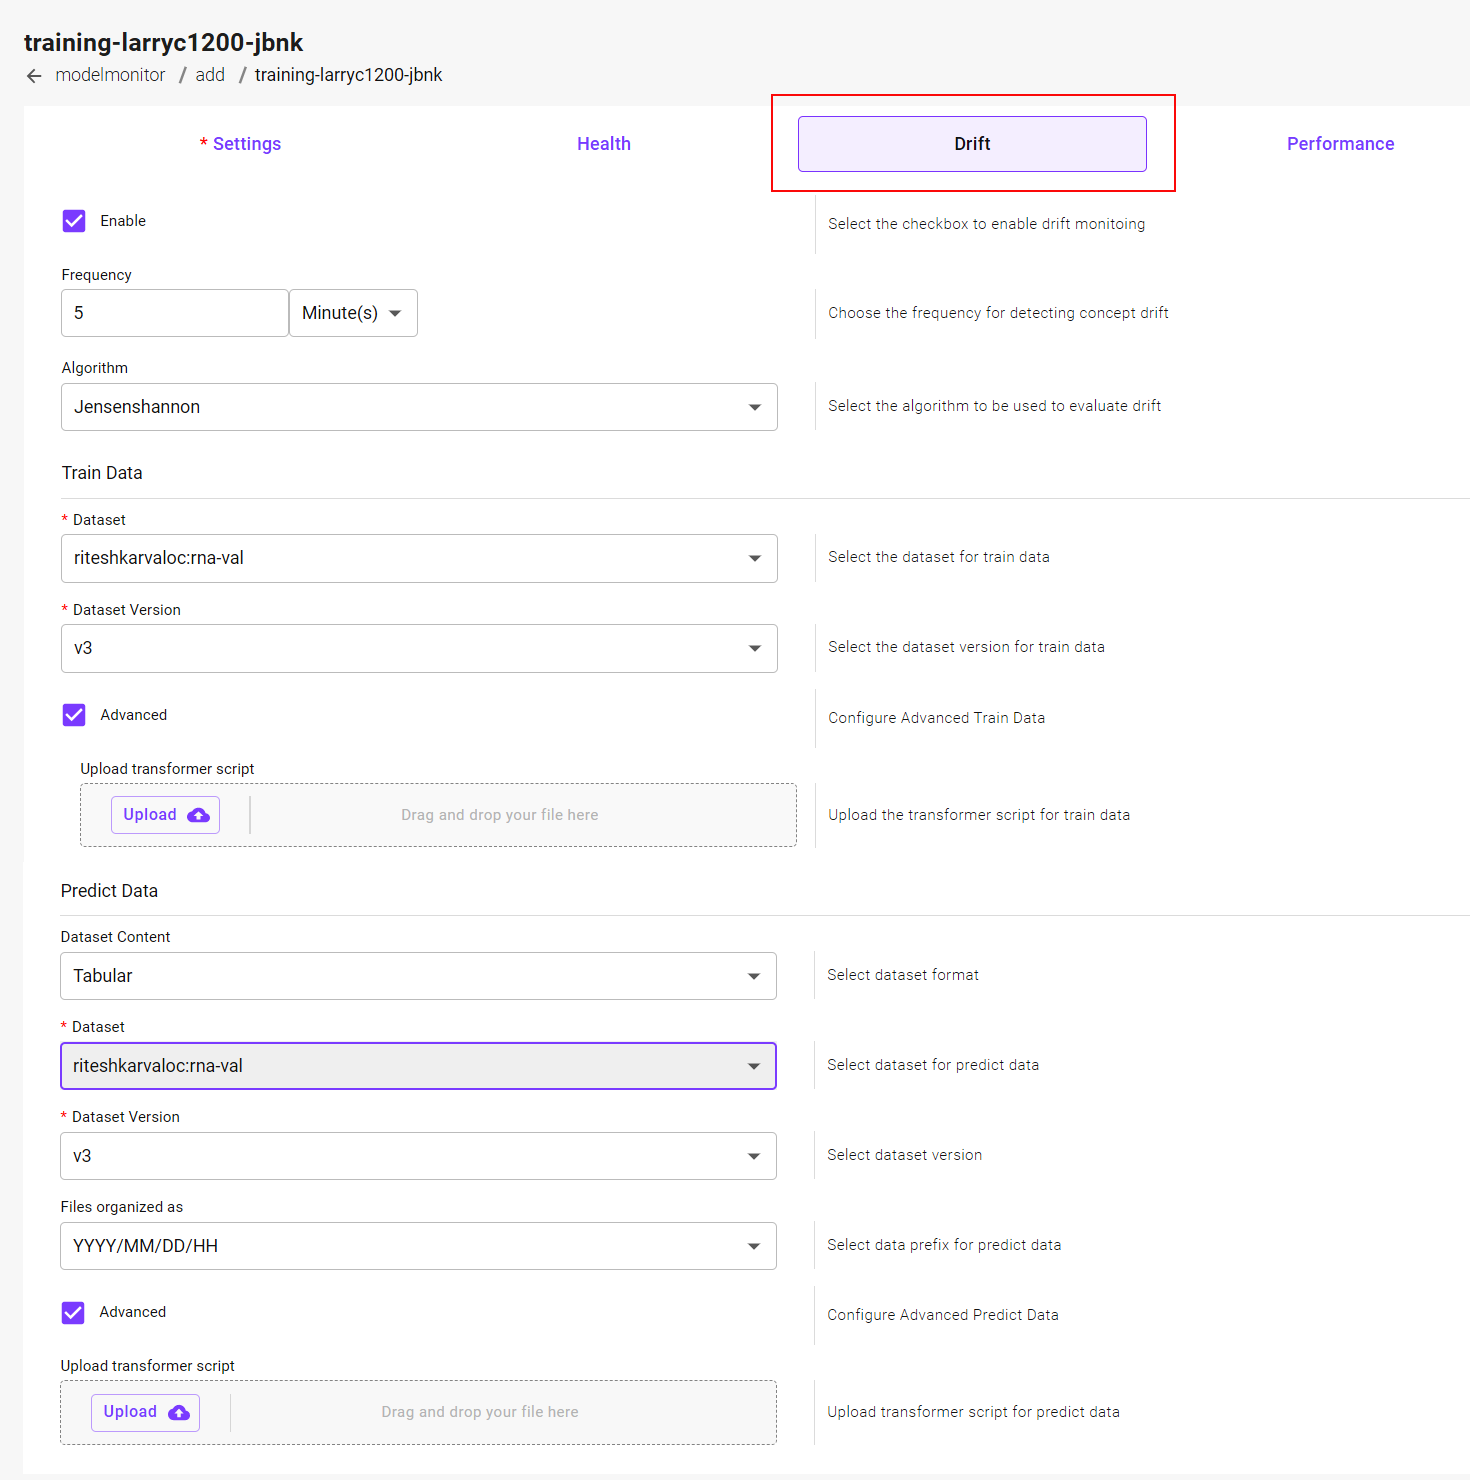
Field |
Description |
|---|---|
Enable |
Enable data drift monitor |
Frequency |
Select how often the monitor should run |
Algorithm |
Choose the algorithm to use for evaluating data drift |
Train Data |
|
Dataset/Version |
Original training dataset name and version that should be used for the monitor |
Advanced |
Select to add additional inputs if required |
Upload Transformer Script |
Optional script if necessary to preprocess or postprocess the original training data |
Predict Data |
|
Dataset Content |
Format & source of model prediction dataset |
Advanced |
Select to add additional inputs if required |
Upload Transformer Script |
Optional script if necessary to preprocess or postprocess the deployment prediction data |
The Dataset Content field can be selected as follows:
Selection |
Description |
|---|---|
CloudEventLogs |
Get the deployment prediction data from the cloud |
Tabular |
Get the deployment prediction data a tabular-formatted file |
If the Tabular Dataset Content is selected, the following additional fields will be displayed:
Field |
Description |
|---|---|
Dataset/Version |
Deployment prediction dataset name and version that should be used for the monitor |
Files Organized As |
Folder organization for deployment prediction dataset |
The monitor uses the inputs and outputs to do a comparison based on the frequency selected, and uses the thresholds or alerts to update the current status or trigger an event, as described at Monitoring Results
Performance Decay Monitor
The Performance screen sets up the monitor for metric performance. This is described at Performance Decay
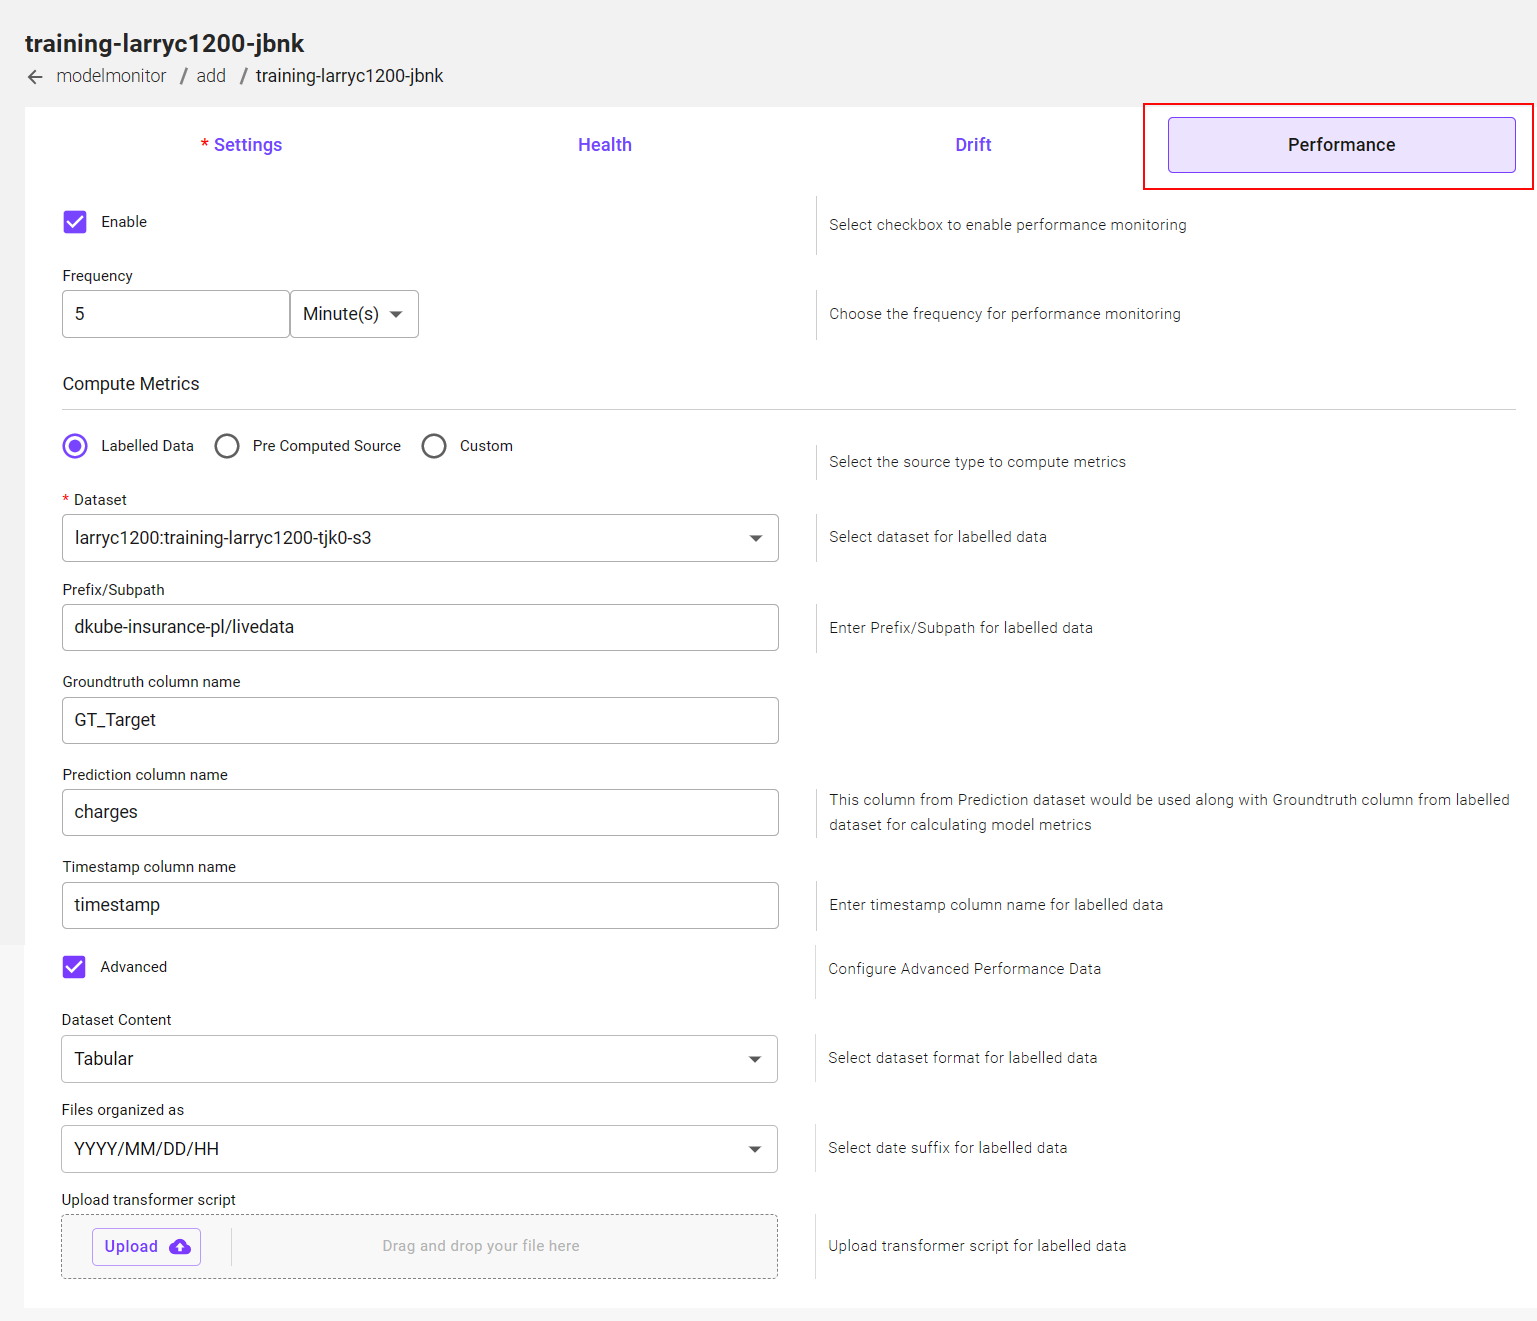
Field |
Description |
|---|---|
Enable |
Enable metric performance monitor |
Frequency |
Select how often the monitor should run |
Compute Metrics |
Select the format of the files to use for the performance metrics |
Labelled Data
The Labelled Data selection expects a dataset file that has columns that provide both the Groundtruth (correct output) and the deployment prediction. Based on this, DKube will calculate the performance for the monitor.
Field |
Description |
|---|---|
Dataset |
Dataset name and version for the calculation |
Prefix/Subpath |
The folder where the dataset resides |
Groundtruth Column Name |
Column header name for the ground truth |
Prediction Column Name |
Column header name for the model prediction |
Timestamp Column Name |
Column header name for the timestamp |
Pre-Computed Source
A Pre-Computed Source provides the full computation of the metrics. DKube does not do the computation, but rather uses the information in the file.
An example of a pre-computed file is available at Pre-Computed Source Example
Custom
A fully custom file for the performance monitoring.
An example of a custom file is available at Custom Metrics Example
Completing the Initial Configuration
After the required tabs have been completed, select the button to start the monitor baselining. This will take the datasets that have been provided and set up the monitor to accept the rest of the configuration. In order to complete the initial configuration, the schema needs to be updated based on the previous configuration.
The schema identifies and characterizes the inputs and outputs for the monitor.
The schema can be completed by going directly to the setup screen from the popup after submission (and wait while baselining is being done), or by returning to the monitoring dashboard to wait for baselining to complete.
Monitor Dashboard
After initial setup, the monitor will go through a baselining status, and once that is complete it will be in the pending status, waiting for the schema to be configured.
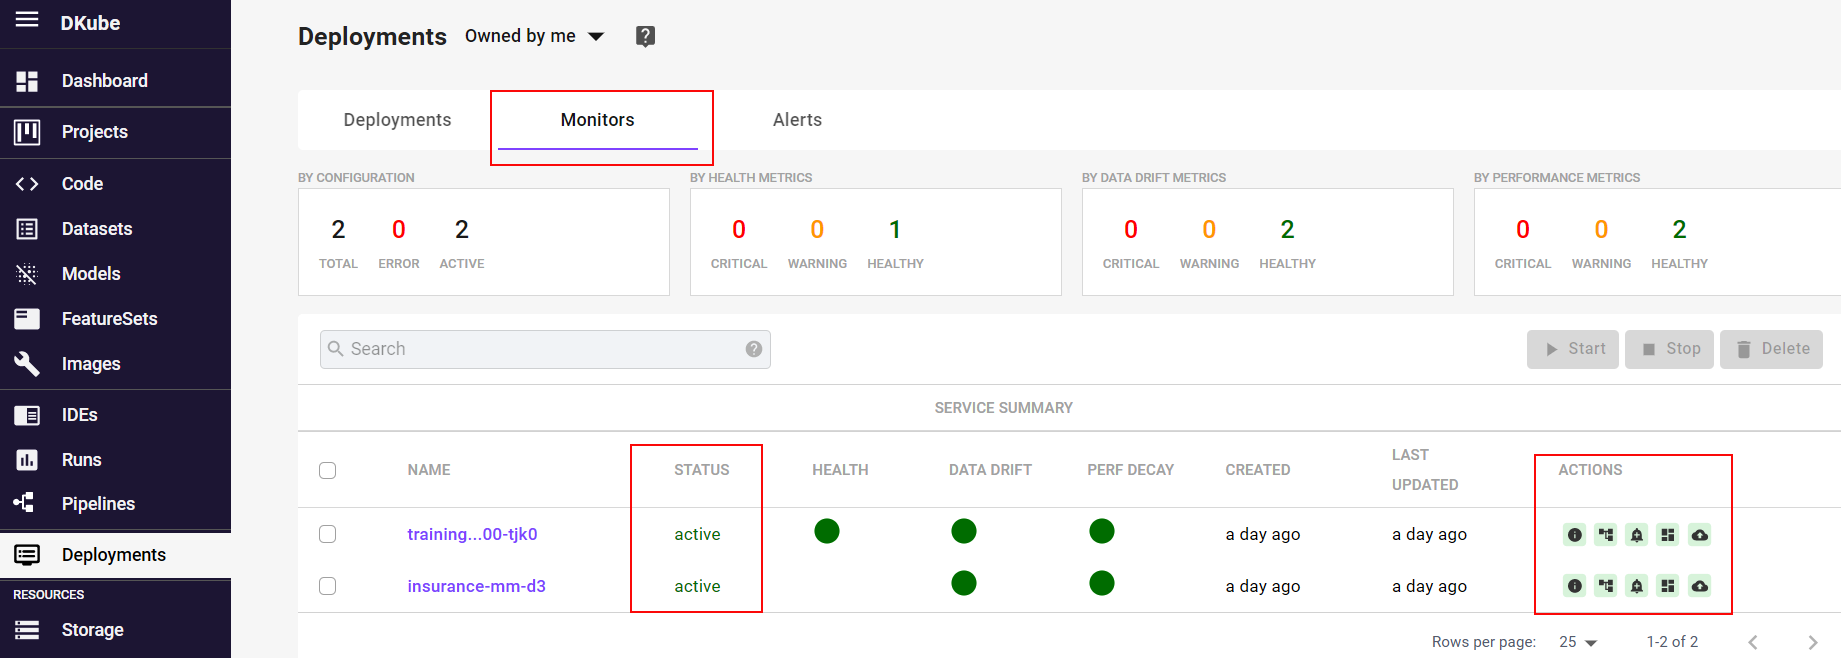
The Monitor dashboard is accessible by selecting the menu on the left, and the Monitors tab on the top of the screen.
The monitor status indications are:
Status |
Meaning |
|---|---|
baselining |
Calculating results after adding datasets |
pending |
Waiting for the schema to be configured |
ready |
Available for monitor, but not active |
Starting |
The monitor is in the process of becoming active |
active |
Running analysis |
Stopping |
The monitor is in the process of becoming ready |
error |
Problem with the monitor |
The following actions are available:
Action |
Description |
|---|---|
Schema |
Mandatory configuration that defines and characterizes the feature inputs and outputs |
Alerts |
Add alerts to get notification of deployment issues, as described at Alerts |
Thresholds |
Upload threshold file for monitor status indications, as described at Status |
Start |
Put the monitor into the active status |
Stop |
Put the monitor in to the ready status |
Delete |
Delete the monitor |
Configure Monitor |
Modify the basic monitor options |
Update Schema |
Modify the monitor schema |
Add Alerts |
Add Alerts for the Monitor |
Add or Edit Dashboards |
Add or modify the dashboard |
Upload Thresholds |
Upload the thresholds for warning (orange) and critical (red) status |
Important
The basic configuration and schema can be viewed and changed within the screen while the Monitor is in the active state, but must be in the ready (stopped) state to update them
Update Schema
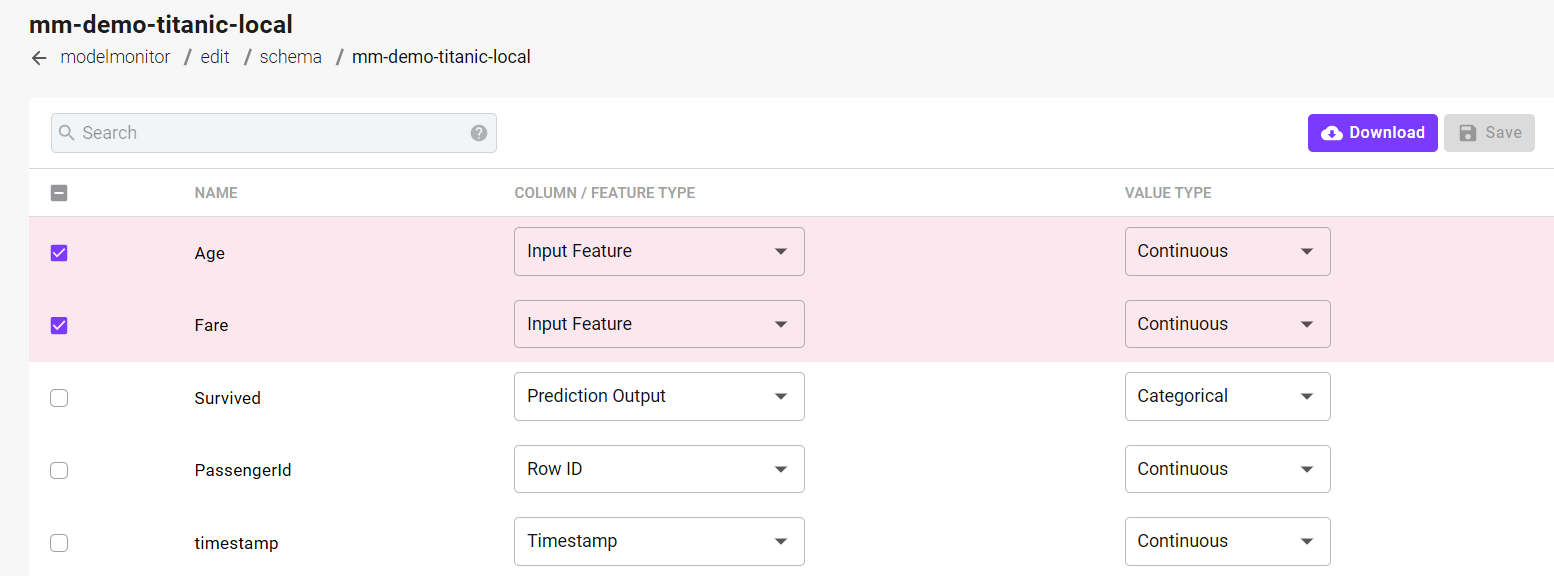
The Schema identifies the input and output features for the monitor, and provides their characteristics. The schema needs to be updated after the initial monitor setup to become ready.
The schema is updated by selecting its icon at the far right of the monitor name.
The Schema screen lists the features that are part of the training data. From this screen, you can choose which features to monitor, what type of feature it is (input, prediction, etc), and whether the feature is continuous (a number) or categorical (something is a distinct category such a true or false).
After the schema is configured, the monitor go from the pending to the ready status.
Important
The schema can be viewed and changed within the screen while the Monitor is in the active state, but must be in the ready (stopped) state to update the schema
Add Alerts
Alerts provide notifications when an input or output of the Model drifts out of tolerance, as described at Alerts
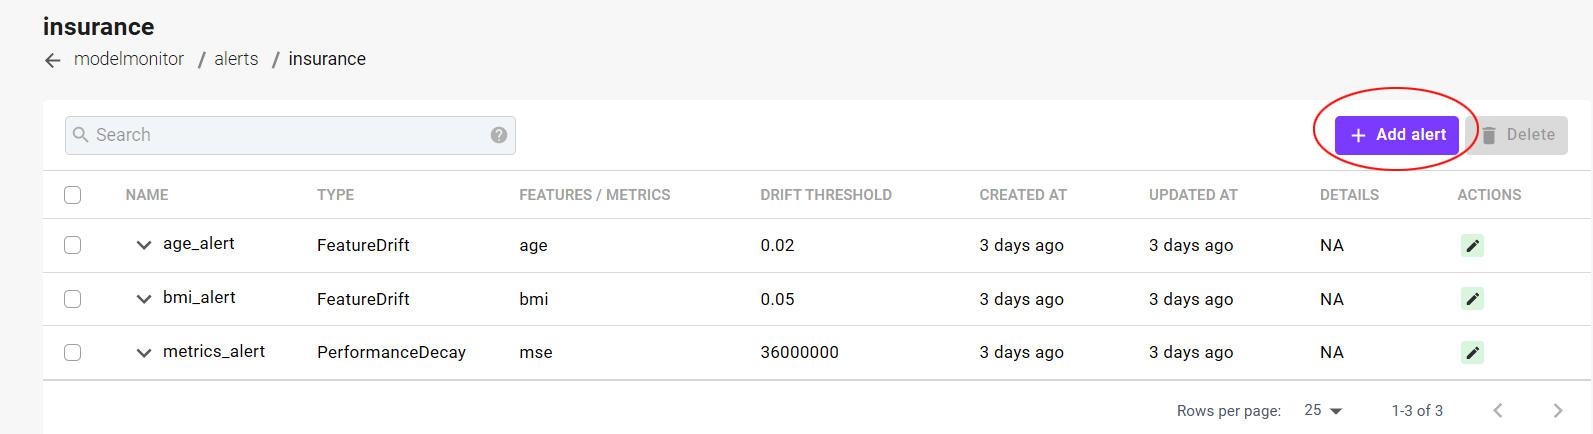
Alerts can be added by selecting the Alerts icon in the actions section of the dashboard screen. This will bring up the Alerts screen.
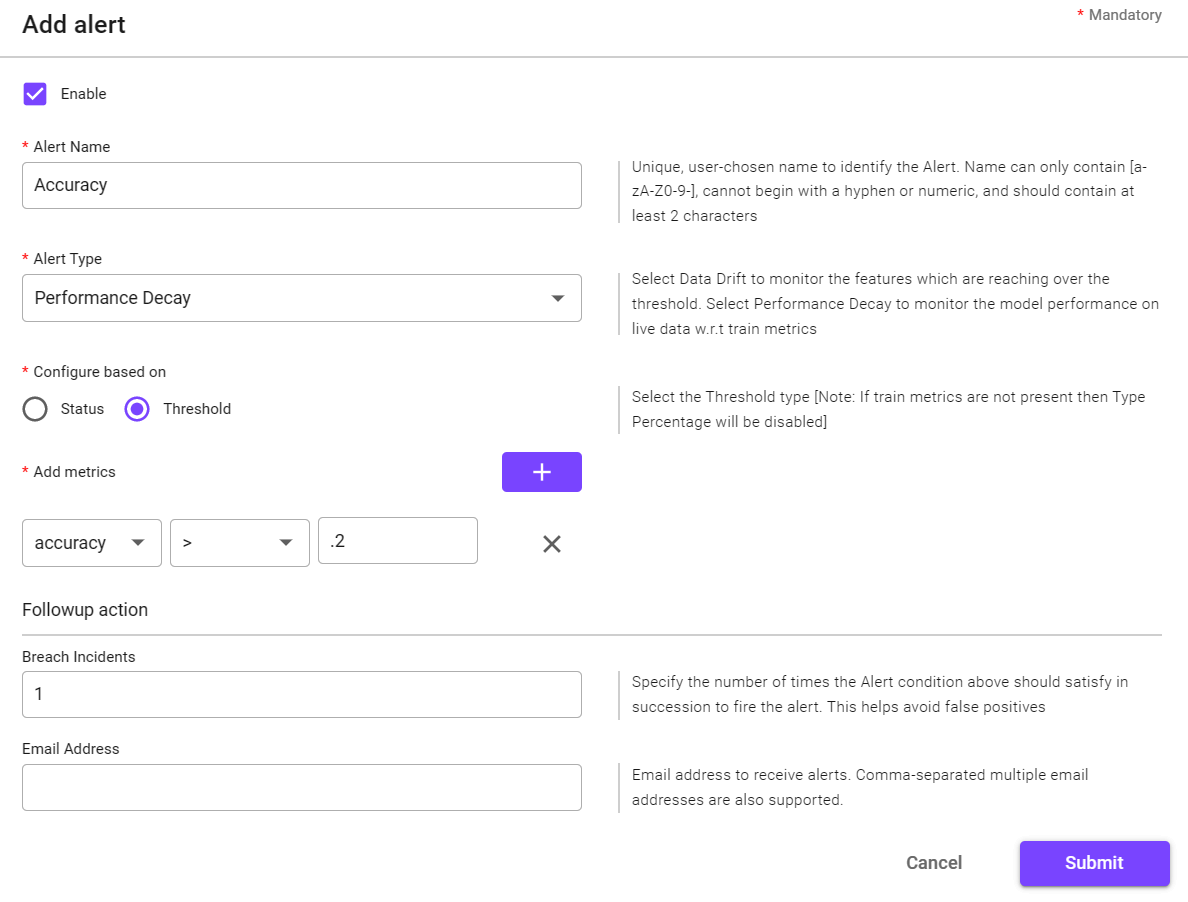
The Alerts screen shows the alerts that have already been added for that monitor, and allows the user to create a new alert. The Alert is configured by selecting what type of Alert is monitored. In each case, an email can optionally be configured to notify an Alert trigger.
Field |
Description |
|---|---|
Enable |
Enable the alert to be active - the alert can be disabled later by editing it |
Alert Name |
User-chosen name for the alert |
Alert Type |
Type of comparison, such as data drift, performance decay, or Deployment Health - described at Monitoring Concepts |
Configure Based On |
Create alert based on status or threshold - described at :ref:monitor-concepts-results` |
If Status |
Select the feature and what status should trigger the alert - described at Status |
If Threshold |
Select the feature and what threshold should trigger the alert - described at Alerts |
Breach Incidents |
Optionally set the number of times the feature matches the threshold before triggering an alert |
Email Address |
Optionally provide an email address to use when an alert is triggered |
The alert will show up on the list of Alerts once successfully created.
Alerts can be edited from the Alert List screen by selecting the Edit icon on the far right.
Upload Threshold File
The status of a feature or metric can be monitored as described at Status
A Threshold file can be uploaded by selecting the Upload Thresholds icon in the action section at the right of the monitor name. This will create a popup that allows the file to be uploaded.
Edit an Existing Monitor
An existing monitor can be modified by selecting the Edit Monitor icon on the right of the monitor summary.
Important
The monitor basic setup can be viewed and changed within the screen while the Monitor is in the active state, but must be in the ready (stopped) state to update the monitor
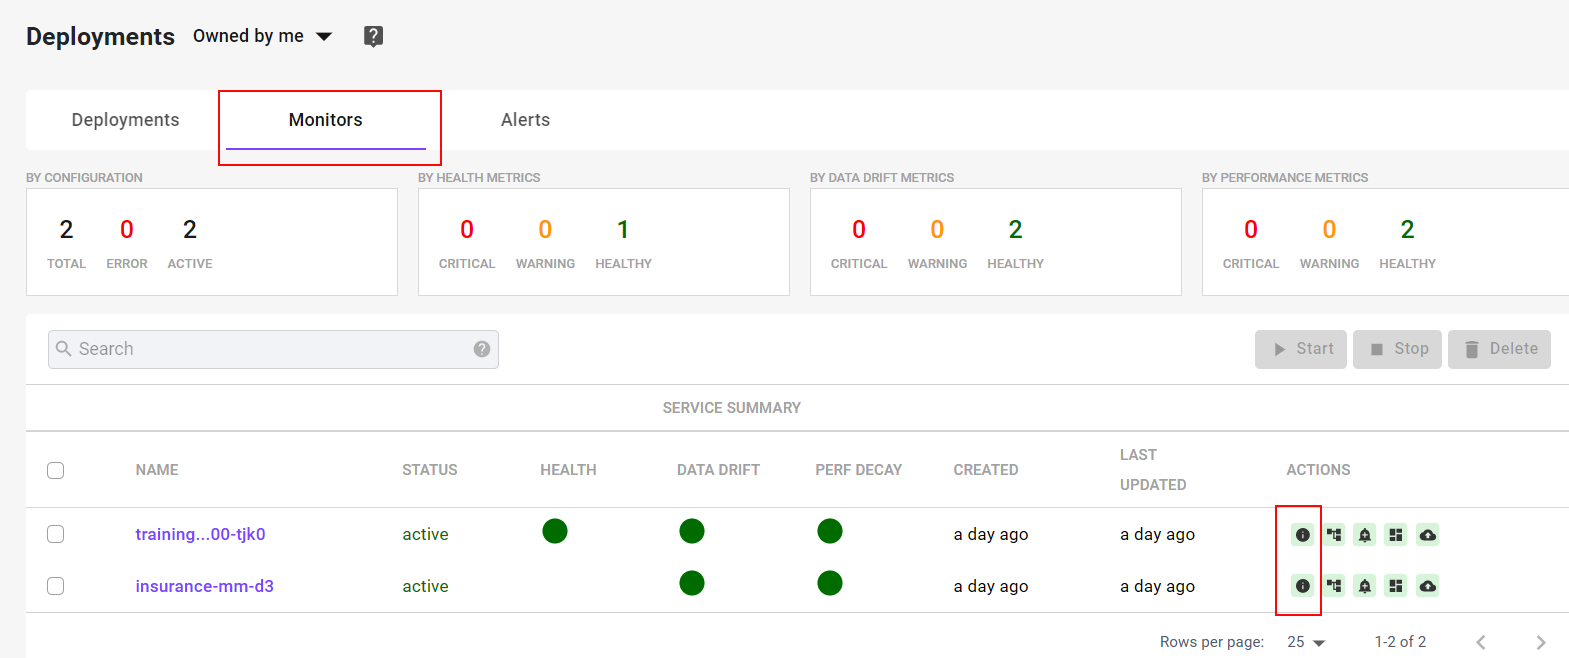
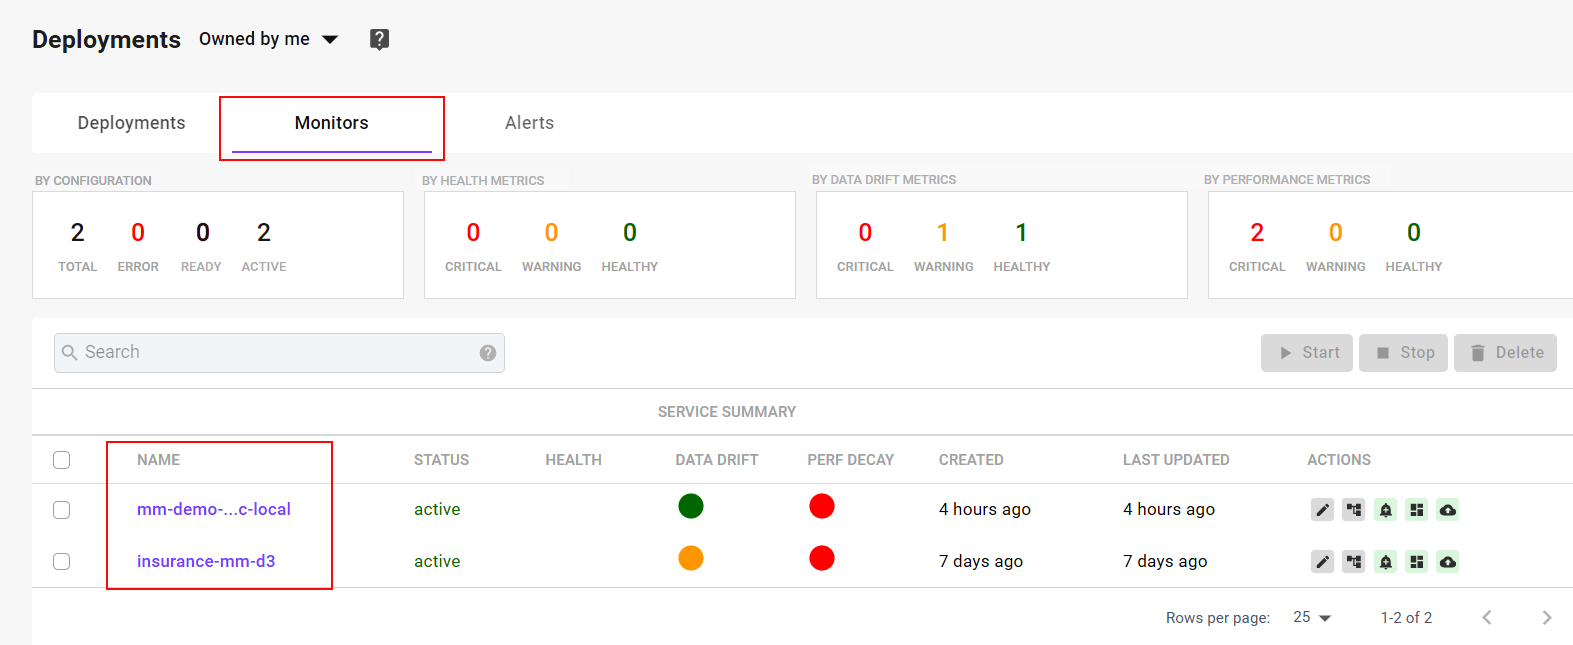
Reviewing Monitor Status
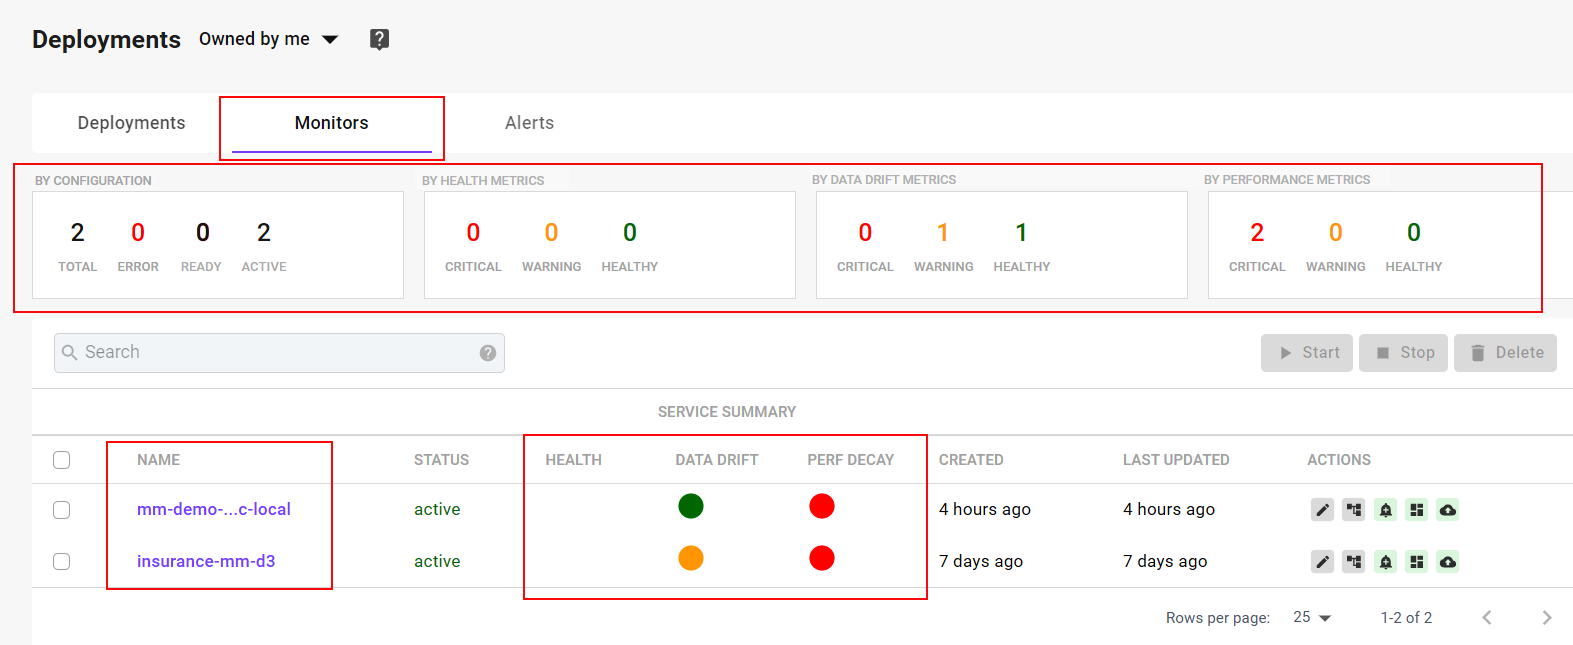
The Monitor Dashboard can be used to review the status of the monitors. The top section provides information on the status of all the monitors running. It shows the number of monitors and their respective status, as described at Status
Each monitor has its own status indication, based on the same thresholds.
The status indications are defined as follows:
Status |
Definition |
|
|---|---|---|
Healthy |
|
All feature drifts and metrics are below their individual thresholds |
Warning |
|
At least one feature drift or metric is greater than its soft threshold, but none are above the hard threshold |
Critical |
|
At least one feature drift or metric is greater than its hard threshold |
Important
The threshold status colors are based on the last prediction, and are not a cumulative indication of the metrics. They are also not related to Alerts, which have their own set of thresholds and triggers.
Alerts Dashboard
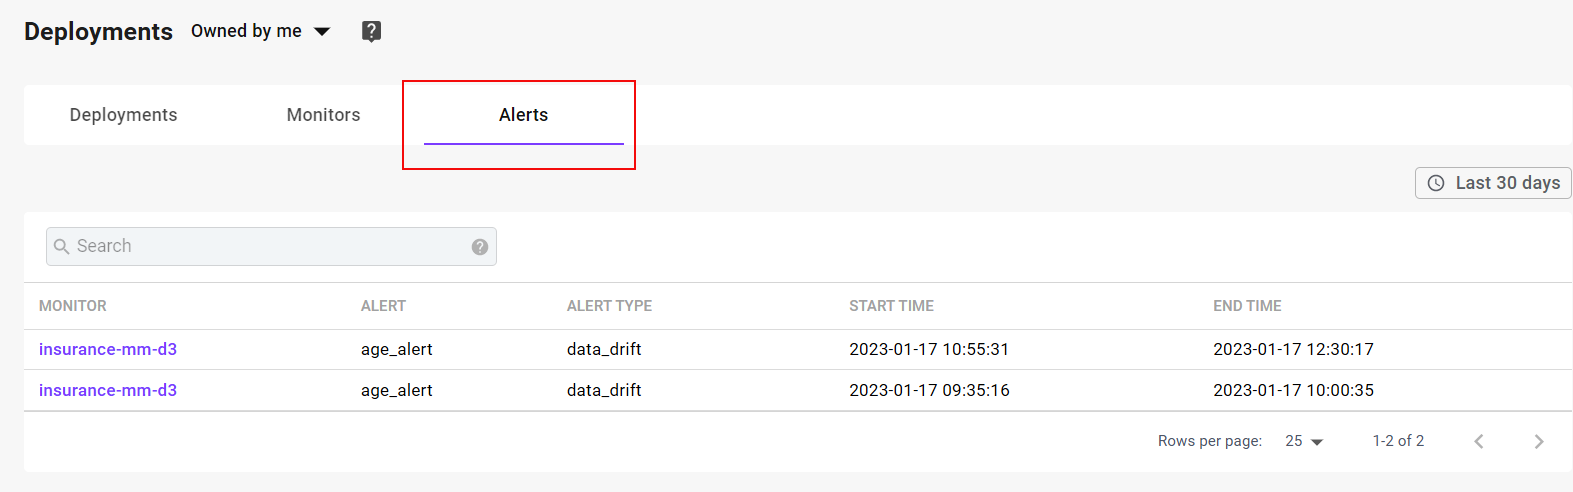
The Alerts Dashboard shows all of the alerts that have been triggered within DKube, across all of the monitors. It provides information on the monitor name, alert name, type of alert, and the timestamps. The user can go directly to the monitor by selecting the monitor name.
Monitor Details
The process of identifying the root cause of a monitor deviation involves successively reviewing more information on a Status or Alert. From the Monitor Dashboard, select one of the monitors to find out more details on that monitor by selecting the monitor name.
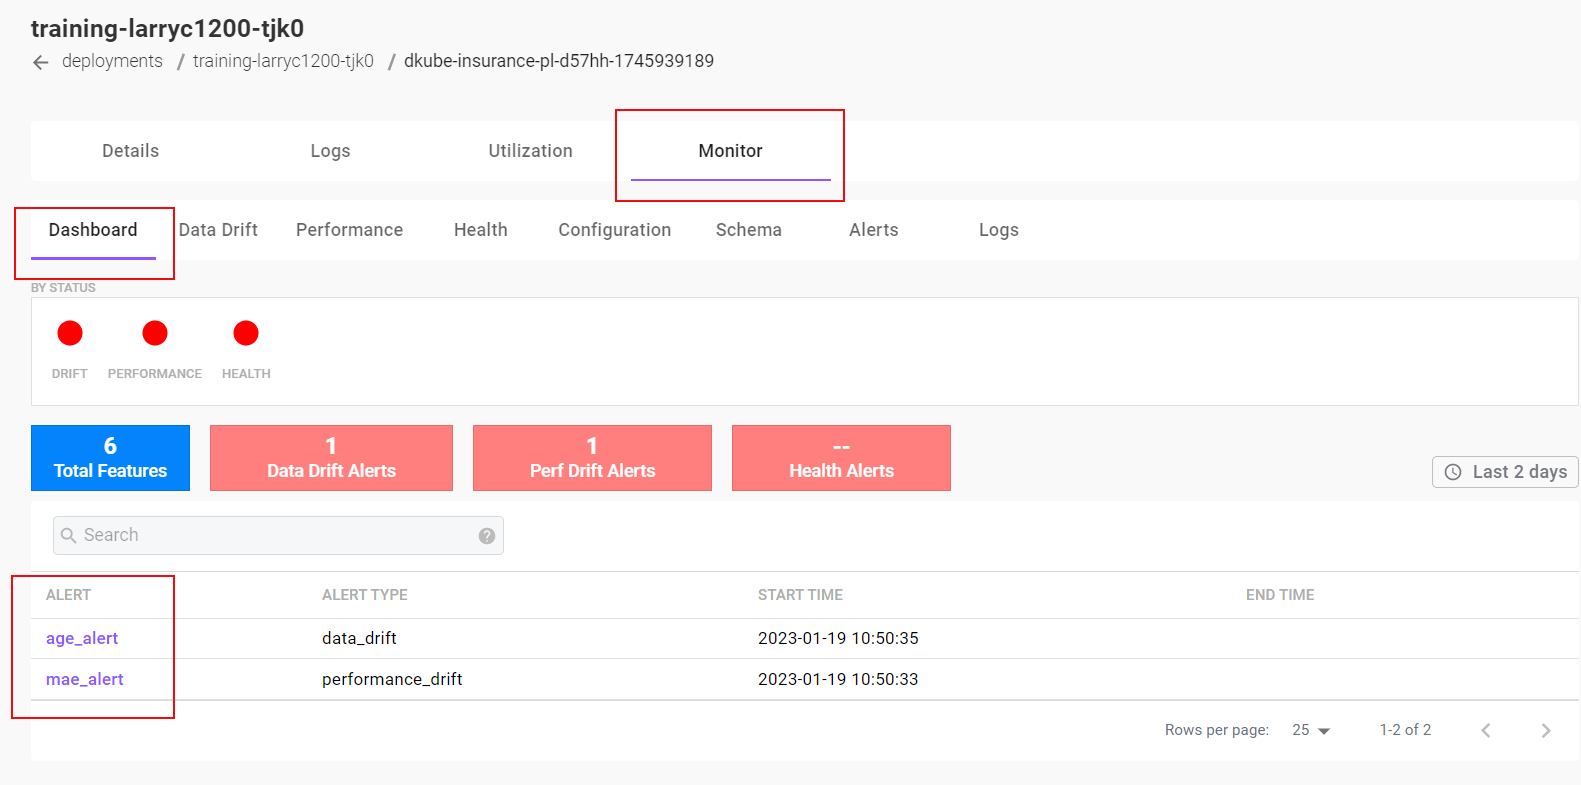
This brings up a dashboard for that specific monitor, with the associated details. It includes:
The current status of the monitor features & metrics
A list of triggered Alerts for that monitor only, for the selected timeframe (selected on the right)
A summary of the Alert can be obtained by selecting the Alert name.
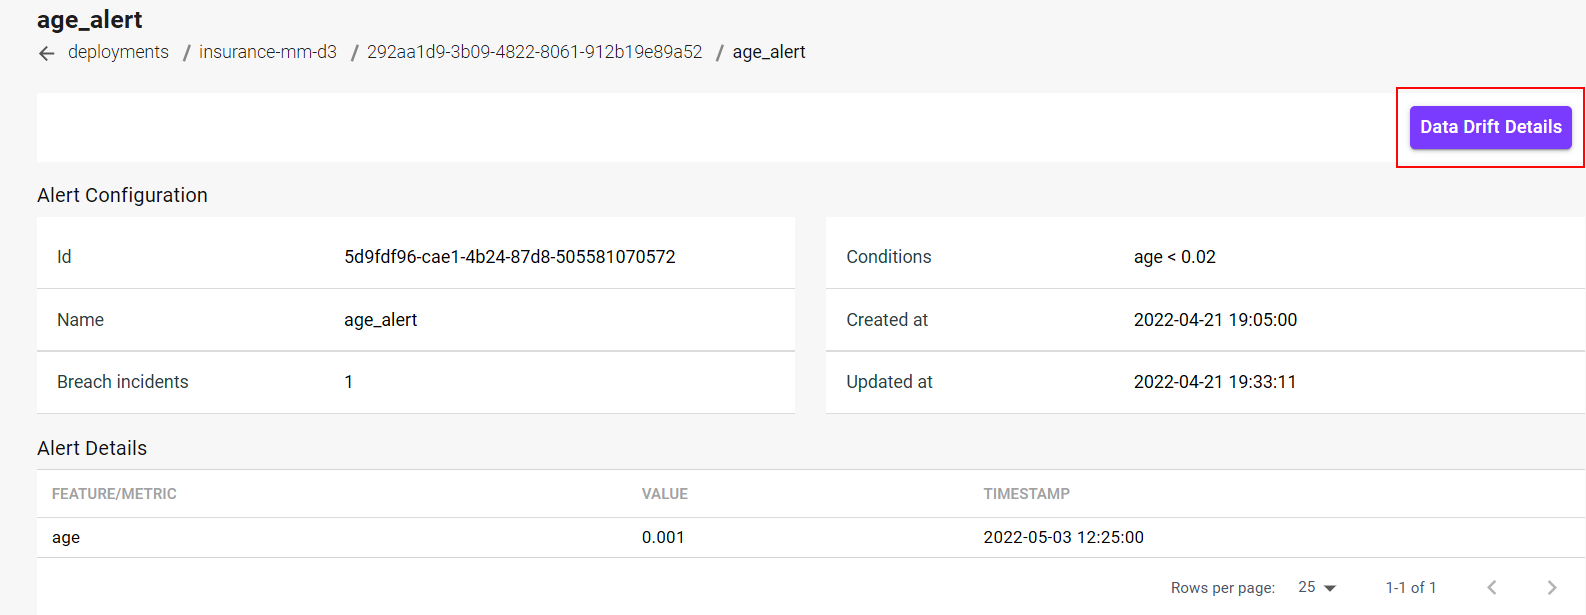
More details on the Alert can be obtained by selecting the name of the Alert. Once on the alert details screen, you can go back to the summary screen by selecting the button at the top right.
Data Drift
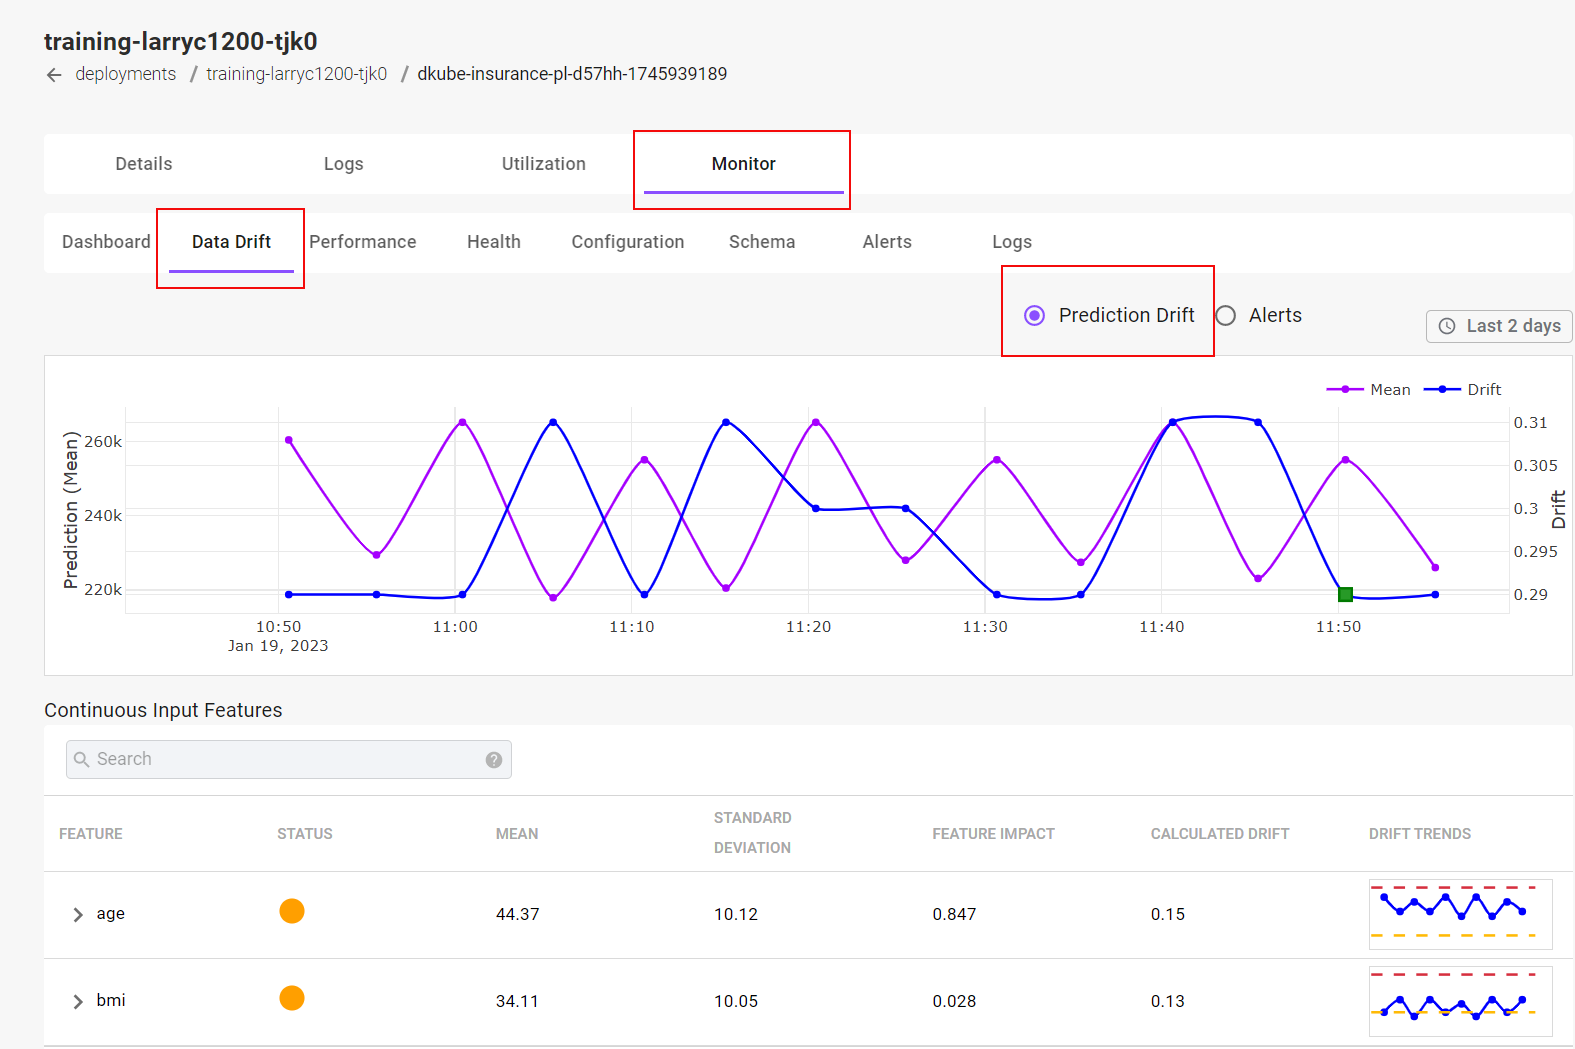
Data Drift Graph for Tabular Data
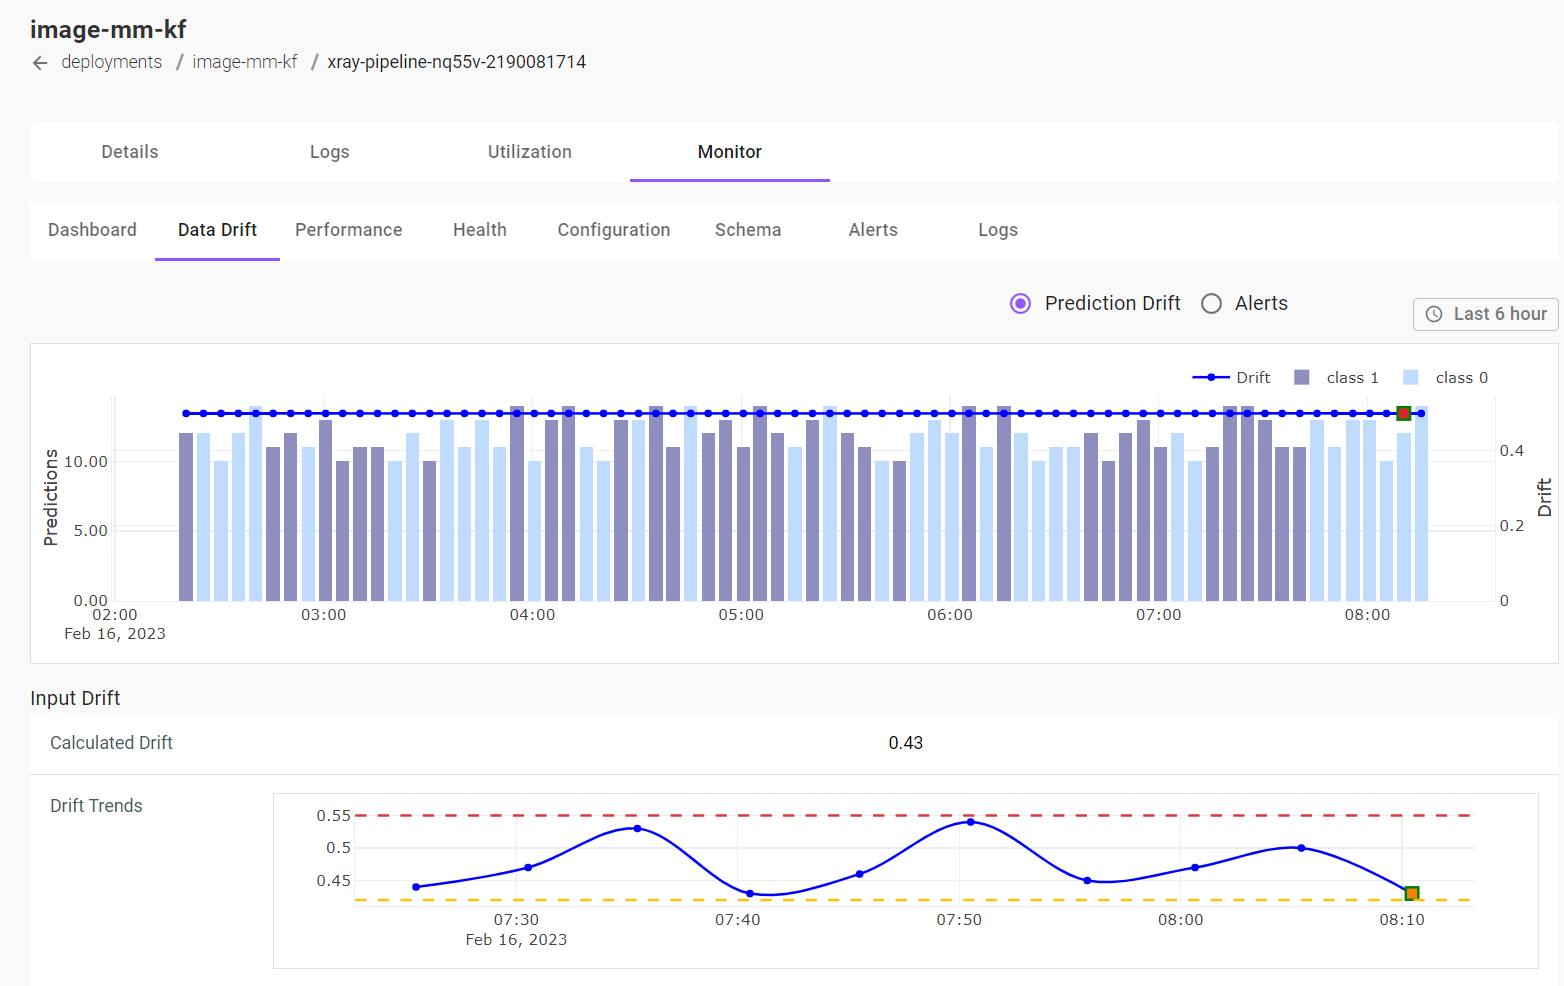
Data Drift Graph for Image Data
Selecting the Data Drift tab provides graphs and tables that help to identify what has drifted, with more information to determine why it has drifted. There are 2 graphs, selected by using the radial button.
Prediction Drift
The top Prediction Drift graph overlays the mean of the model predictions with the Drift for the Output Feature shown below the graph. This is described at Data Drift
Note
The individual graphs can be enabled or disabled by selecting the graph color key at the top right of the graph area
The details of the output feature drift are available below the summary graph at the bottom of the screen. The name of the feature can be expanded with the caret icon at the left.
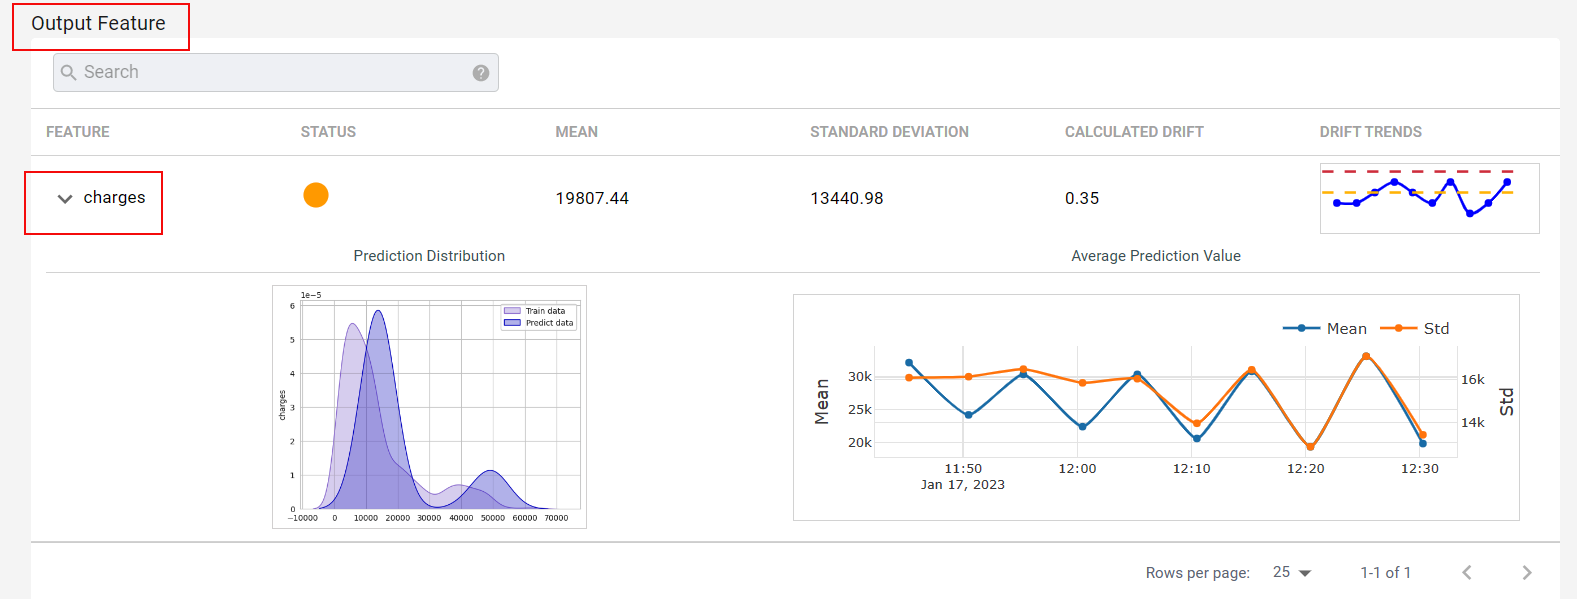
The top line provides a summary of the feature, including the calculated drift and a trend graph. Below that is a distribution graph show how the predictions compare to the original training predictions. There is also a graph that shows the mean predictions and the standard deviation over time.
Input Drift
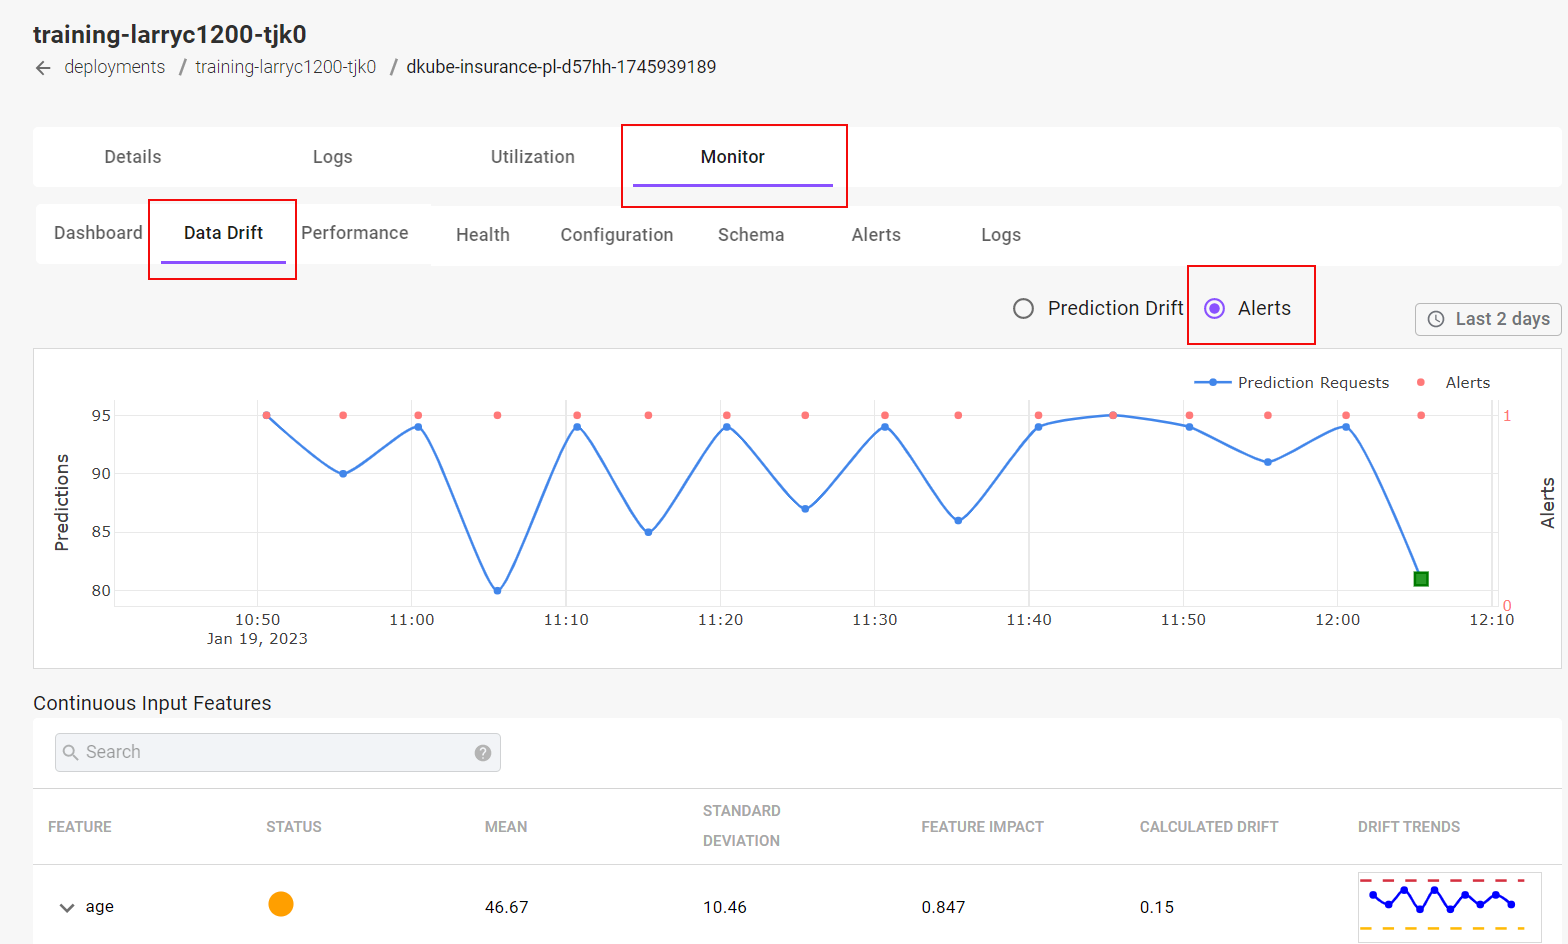
The Input Data Drift information is displayed by selecting the “Alerts” radial button at the top right. This shows the number of predictions and identifies Data Drift Alerts.
More details for each feature can be viewed by selecting the caret icon to the left of the feature.
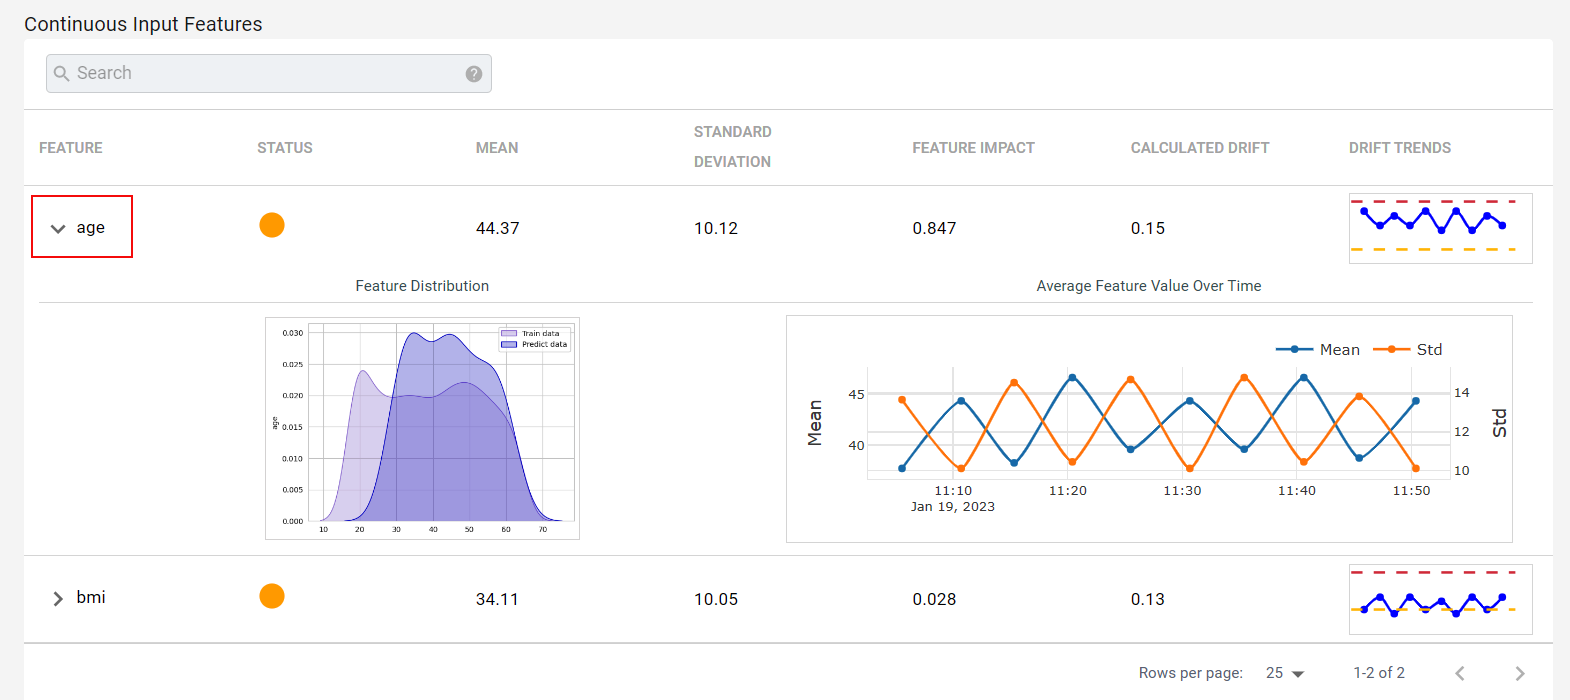
Data Drift Input Details for Tabular Data
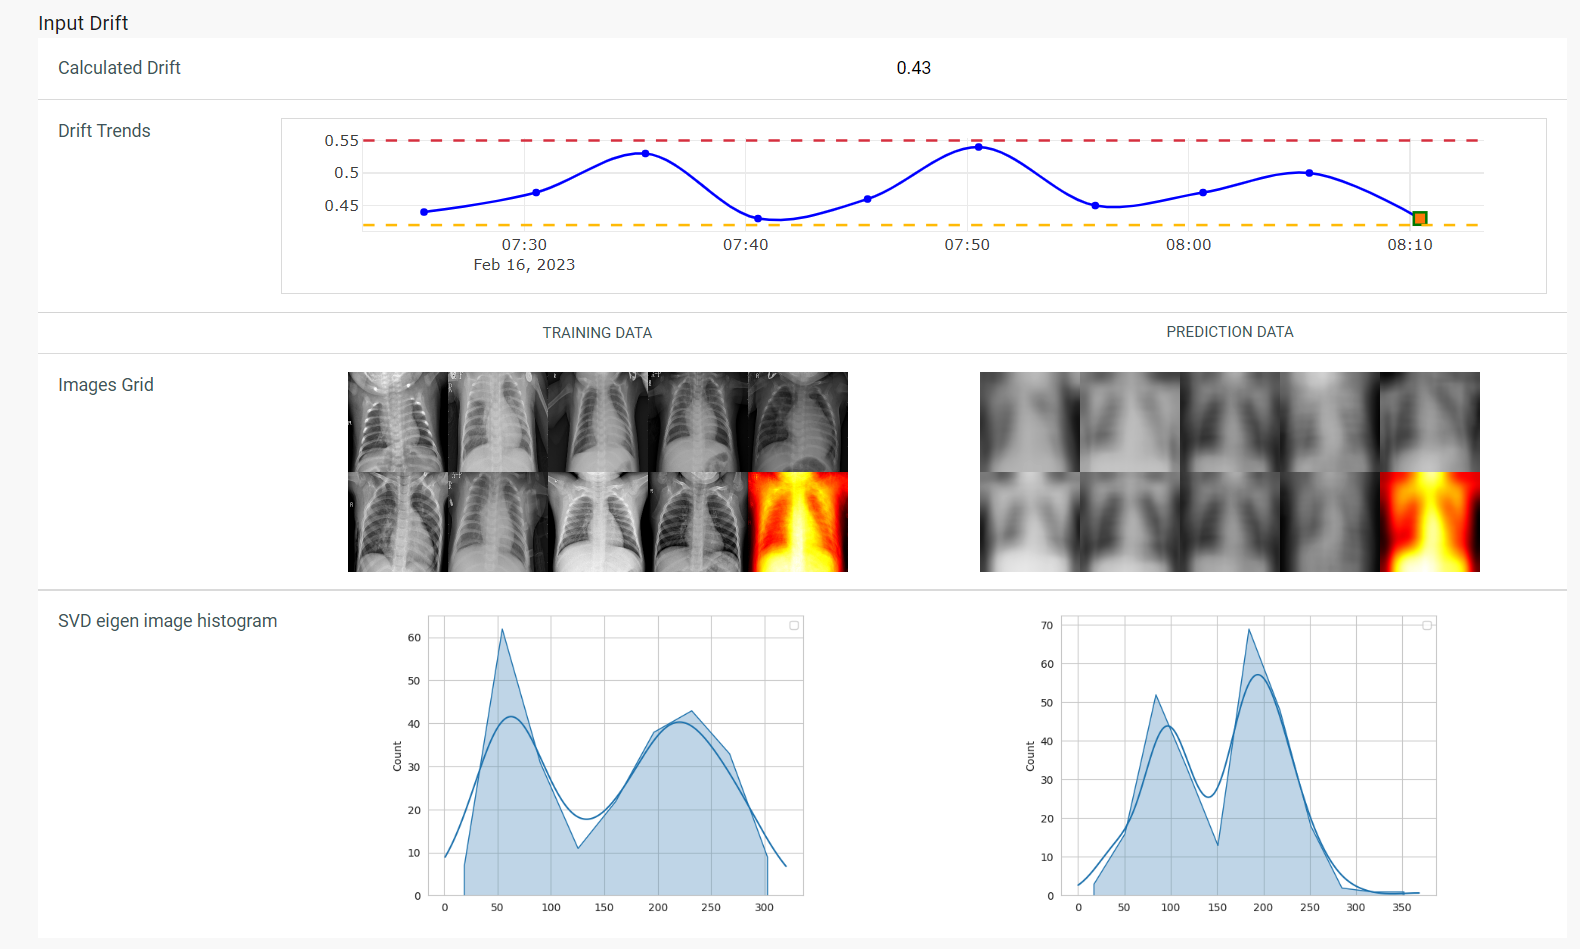
Data Drift Input Details for Image Data
For monitoring on Image data, the input drift graphs provide the input images for training and prediction, as well as:
An image heat map
A histogram of the image that shows the grayscale pixel values and the count of how often that pixel value occurs
Performance Decay
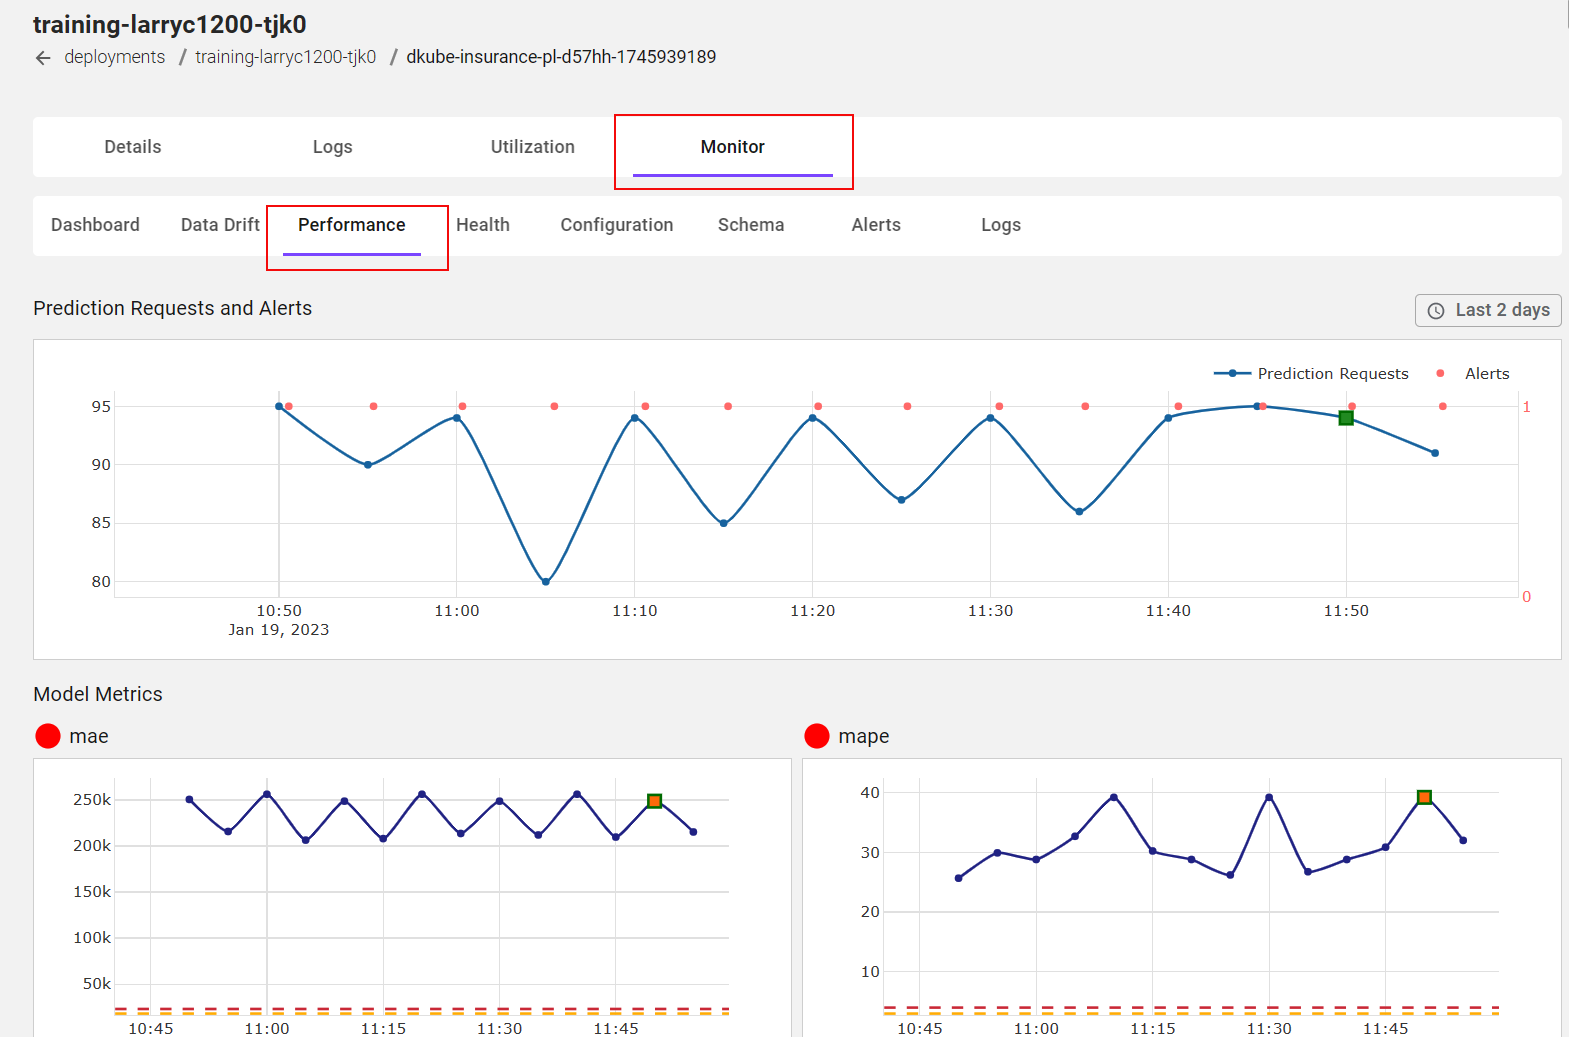
If the Performance teb is selected, the graphs show how well the Model is performing based on the chosen Model metrics. This is described in more detail at Performance Decay The top graph combines the number of production requests and the number of performance alerts.
The bottom graphs show how each individual metric is performing.
Configuration, Schema, & Alerts
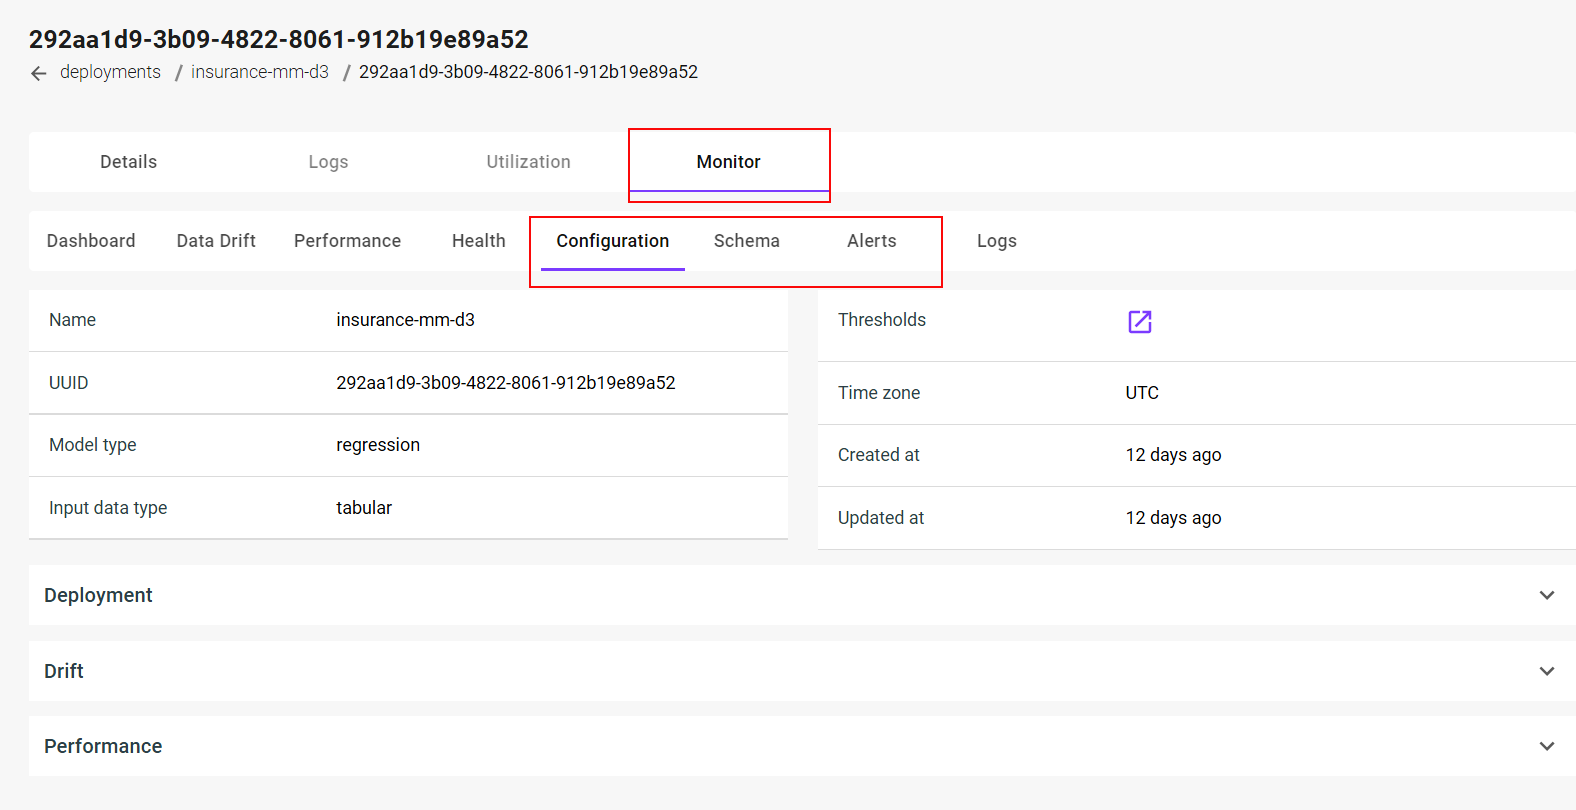
The Configuration, Schema, and Alerts tabs allows the user to view the options used for the monitor.