Metrics

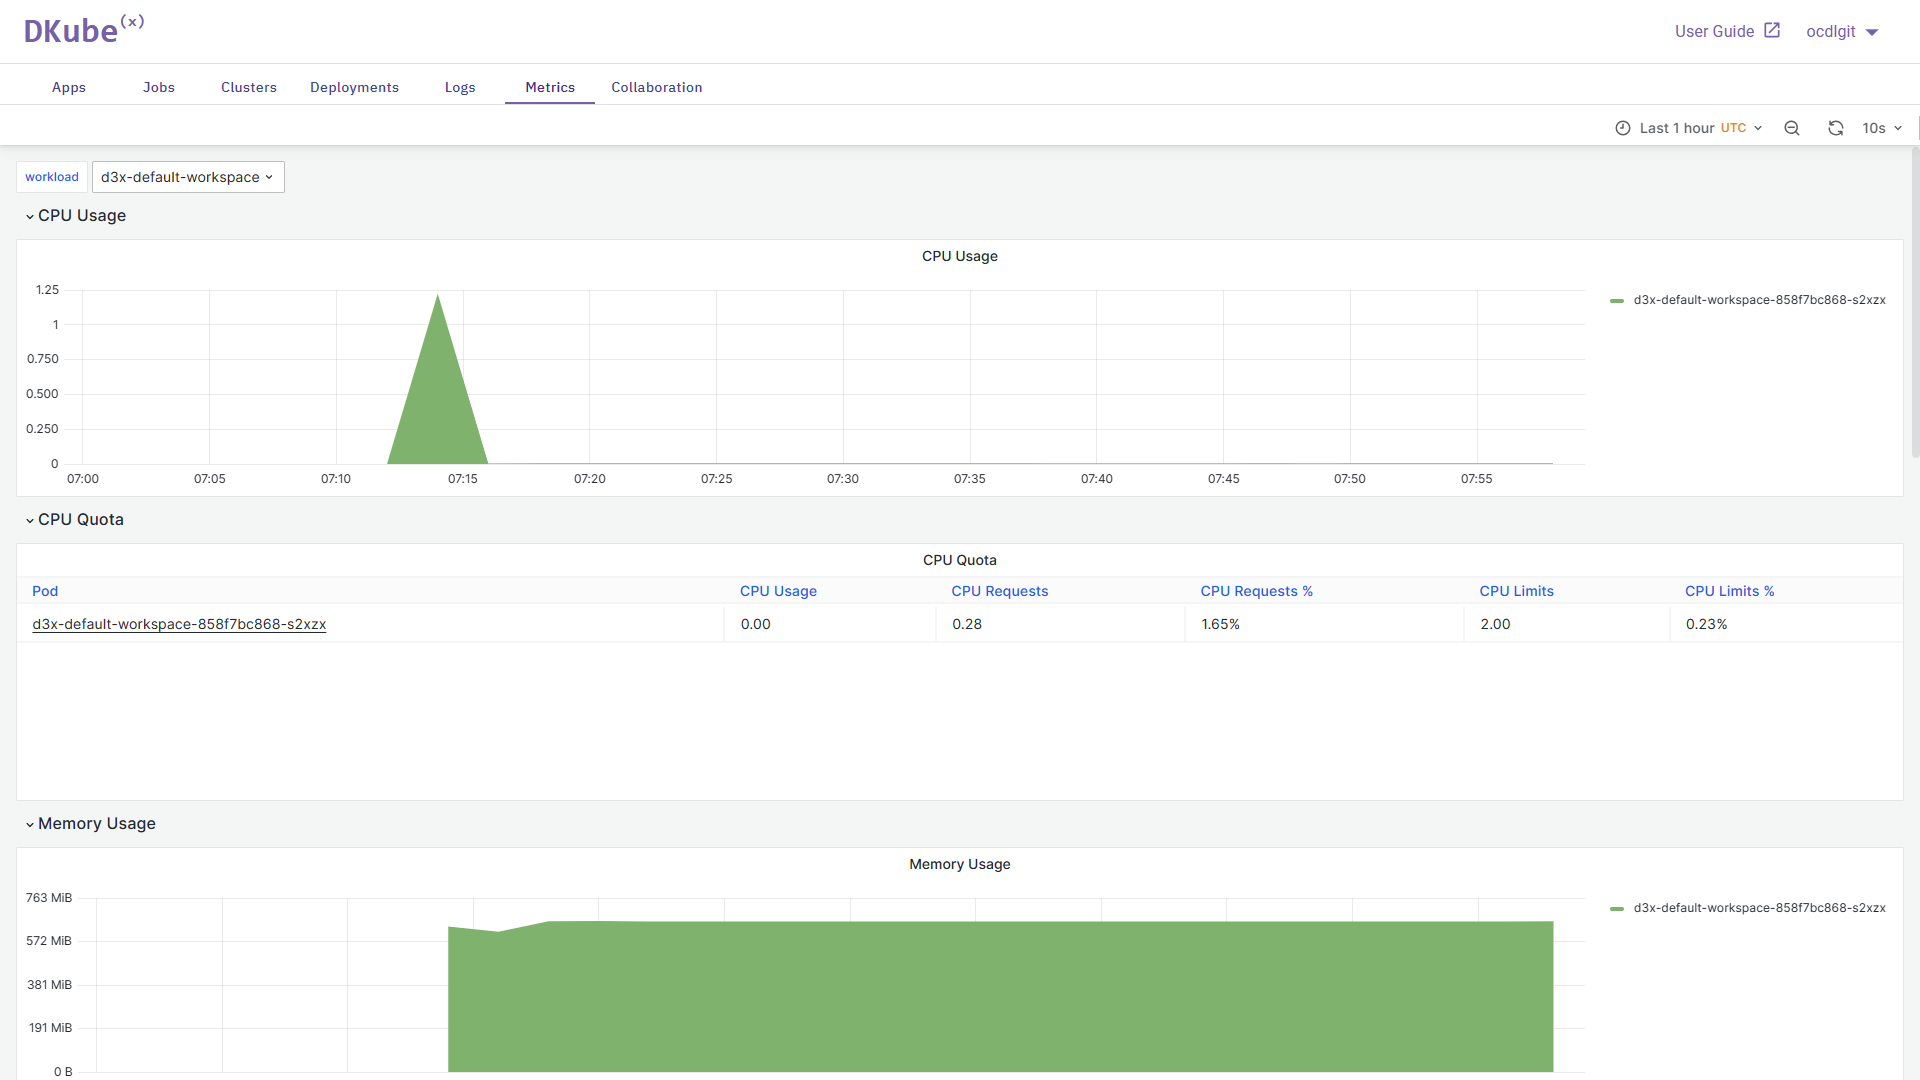
The metrics tab in DKubeX UI records and views all computational usage data in real time, and provides statistics for your workspace. Workload metrics for your particular workspace can be viewed by selecting the workload dropdown menu and selecting the particular workspace from there. Also on the top-right corner of the tab you can select the time range for which you want to view the metrics, and also the refresh rate for the metrics tab.
This tab is divided and tabulated into a few sections.
By clicking on any of the pod names provided, you can view more detailed metrics of that particular pod.
Section |
Description |
|
|---|---|---|
GPU Usage |
Graphical representation of GPU usage by the workspace over time |

|
CPU Usage |
Graphical representation of CPU usage by the workspace over time |

|
CPU Quota |
Provides real time pod-specific data of CPU usage against the total amount of CPU resources allotted |

|
Memory Usage |
Graphical representation of memory usage by the workspace over time |

|
Memory Quota |
Provides real time pod-specific information on memory usage against the total amount of memory resources allotted |

|
Current Network Usage |
Provides real time pod-specific information on network and bandwidth usage, along with dropped transmitted/received packets |

|
Bandwidth |
Graphical representation of received and transmitted bandwidth usage by the workspace over time |

|
Average Container bandwidth by Pod |
Graphical representation of average network bandwidth used by all the containers of the pod |

|
Rate of Packets |
Graphical representation of rate of received and transmitted packets by the workspace over time |

|
Rate of Packets Dropped |
Graphical representation of rate of dropped packets while receiving or transmitting by the workspace over time |

|